
Landlord's Agent in 2012
Gregory Tomlin
Jobin Realty
(703) 203-9434
31 Total Sales


Estimated Value: $315,267 - $323,000
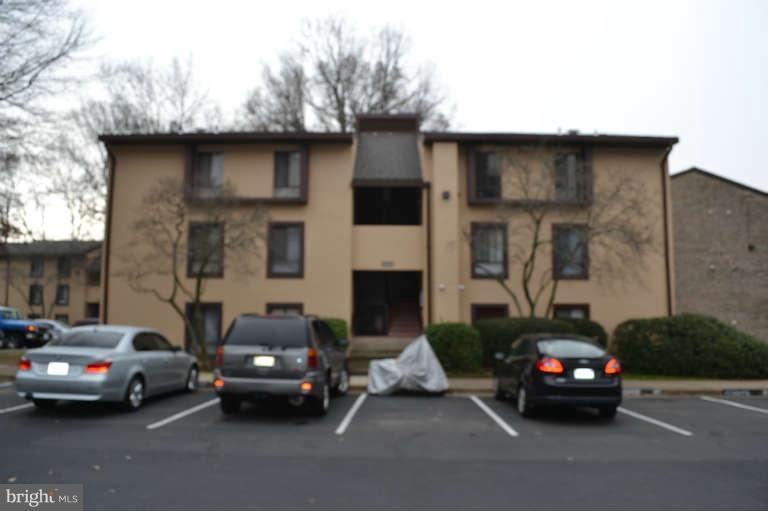
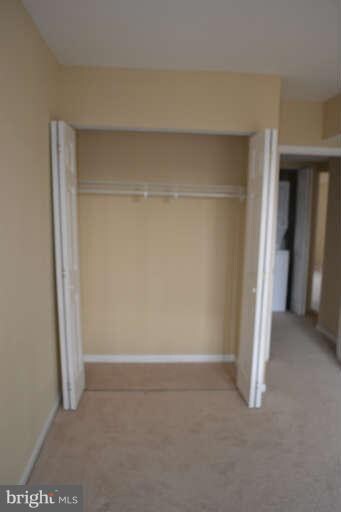
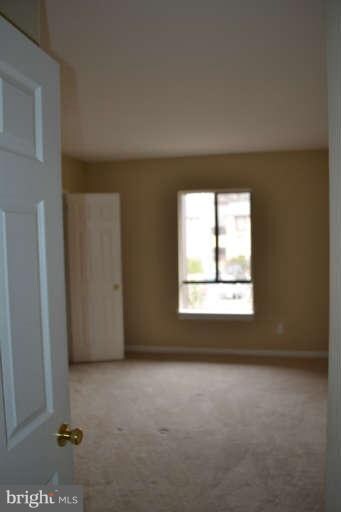
Spacious Condo in great location! Neutral paint and lots of natural light through out. MBr with large walk in closet!! All utilities included!!
Last Agent to Rent the Property
(703) 203-9434 greggtomlin@gmail.com Jobin Realty License #0225061630 Listed on: 12/10/2012
| Date | Buyer | Sale Price | Title Company |
|---|---|---|---|
| Law Caring C | $134,900 | -- | |
| Federal National Mortgage Association | $188,000 | -- | |
| Opata Stephen | $220,500 | -- | |
| Swanson Jeffrey A | $71,999 | -- |
| Date | Status | Borrower | Loan Amount |
|---|---|---|---|
| Open | Law Caring C | $131,450 | |
| Previous Owner | Swanson Jeffrey A | $74,158 |
| Date | Event | Price | List to Sale | Price per Sq Ft |
|---|---|---|---|---|
| 12/28/2012 12/28/12 | Rented | $1,700 | 0.0% | -- |
| 12/21/2012 12/21/12 | Under Contract | -- | -- | -- |
| 12/10/2012 12/10/12 | For Rent | $1,700 | -- | -- |
| Year | Tax Paid | Tax Assessment Tax Assessment Total Assessment is a certain percentage of the fair market value that is determined by local assessors to be the total taxable value of land and additions on the property. | Land | Improvement |
|---|---|---|---|---|
| 2025 | $3,276 | $271,760 | $54,000 | $217,760 |
| 2024 | $3,276 | $271,760 | $54,000 | $217,760 |
| 2023 | $3,042 | $258,820 | $52,000 | $206,820 |
| 2022 | $2,827 | $237,450 | $47,000 | $190,450 |
| 2021 | $2,635 | $215,860 | $43,000 | $172,860 |
| 2020 | $2,506 | $203,640 | $41,000 | $162,640 |
| 2019 | $2,423 | $196,940 | $37,000 | $159,940 |
| 2018 | $2,117 | $184,060 | $37,000 | $147,060 |
| 2017 | $2,160 | $178,780 | $36,000 | $142,780 |
| 2016 | $2,289 | $189,890 | $38,000 | $151,890 |
| 2015 | $2,254 | $193,770 | $39,000 | $154,770 |
| 2014 | $2,124 | $183,010 | $37,000 | $146,010 |
Landlord's Agent in 2012
Gregory Tomlin
Jobin Realty
(703) 203-9434
31 Total Sales
M
Landlord's Co-Listing Agent in 2012
Morgan White
Jobin Realty
Tenant's Agent in 2012
Aman Amery
NBI Realty, LLC
(703) 501-9131
6 Total Sales
Source: Bright MLS
MLS Number: 1004233284
APN: 0262-07530022C
Disclaimer: Certain information contained herein is derived from information provided by parties other than Homes.com. All information provided is deemed reliable, but is not guaranteed to be accurate and should be independently verified.
![]() The data relating to real estate for sale on this website appears in part through the BRIGHT Internet Data Exchange program, a voluntary cooperative exchange of property listing data between licensed real estate brokerage firms, and is provided by BRIGHT through a licensing agreement.
The data relating to real estate for sale on this website appears in part through the BRIGHT Internet Data Exchange program, a voluntary cooperative exchange of property listing data between licensed real estate brokerage firms, and is provided by BRIGHT through a licensing agreement.
Listing information is from various brokers who participate in the Bright MLS IDX program and not all listings may be visible on the site.
The property information being provided on or through the website is for the personal, non-commercial use of consumers and such information may not be used for any purpose other than to identify prospective properties consumers may be interested in purchasing.
Some properties which appear for sale on the website may no longer be available because they are for instance, under contract, sold or are no longer being offered for sale.
Property information displayed is deemed reliable but is not guaranteed.
Copyright 2025 Bright MLS, Inc.