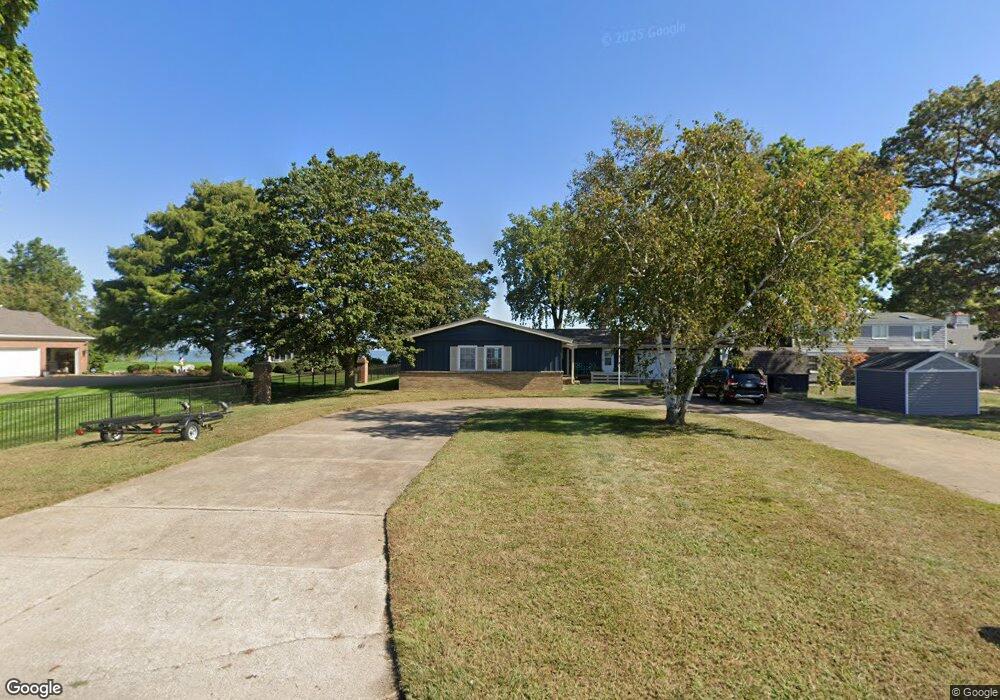
2253 Cedar Point Rd Sandusky, OH 44870
Estimated Value: $526,730 - $845,000
3
Beds
3
Baths
2,080
Sq Ft
$318/Sq Ft
Est. Value
About This Home
This home is located at 2253 Cedar Point Rd, Sandusky, OH 44870 and is currently estimated at $661,183, approximately $317 per square foot. 2253 Cedar Point Rd is a home located in Erie County with nearby schools including Sandusky High School, Monroe Preparatory Academy, and Sandusky Central Catholic School.
Ownership History
Date
Name
Owned For
Owner Type
Purchase Details
Closed on
Feb 4, 2022
Sold by
Ebner Douglass C
Bought by
2253 Cedar Point Llc
Current Estimated Value
Purchase Details
Closed on
Aug 30, 2021
Sold by
2253 Cedar Point Llc
Bought by
Ebner Douglass C
Home Financials for this Owner
Home Financials are based on the most recent Mortgage that was taken out on this home.
Original Mortgage
$286,000
Interest Rate
2.8%
Mortgage Type
New Conventional
Purchase Details
Closed on
Nov 23, 2015
Sold by
Ebner Julia R
Bought by
2253 Cedar Point Llc
Purchase Details
Closed on
Apr 21, 2015
Sold by
Wilke Thomas
Bought by
Ebner Julia R
Home Financials for this Owner
Home Financials are based on the most recent Mortgage that was taken out on this home.
Original Mortgage
$363,600
Interest Rate
3.77%
Mortgage Type
New Conventional
Purchase Details
Closed on
Jan 1, 1987
Bought by
Boitel Earl C Jr&Dolores A Trustees
Create a Home Valuation Report for This Property
The Home Valuation Report is an in-depth analysis detailing your home's value as well as a comparison with similar homes in the area
Purchase History
| Date | Buyer | Sale Price | Title Company |
|---|---|---|---|
| 2253 Cedar Point Llc | $8,500 | None Listed On Document | |
| Ebner Douglass C | $286,000 | None Available | |
| 2253 Cedar Point Llc | -- | Attorney | |
| Ebner Julia R | $404,000 | Hartung Title Order | |
| Boitel Earl C Jr&Dolores A Trustees | -- | -- |
Source: Public Records
Mortgage History
| Date | Status | Borrower | Loan Amount |
|---|---|---|---|
| Previous Owner | Ebner Douglass C | $286,000 | |
| Previous Owner | Ebner Julia R | $363,600 |
Source: Public Records
Tax History
| Year | Tax Paid | Tax Assessment Tax Assessment Total Assessment is a certain percentage of the fair market value that is determined by local assessors to be the total taxable value of land and additions on the property. | Land | Improvement |
|---|---|---|---|---|
| 2024 | $7,867 | $201,694 | $136,790 | $64,904 |
| 2023 | $7,943 | $150,640 | $112,651 | $37,989 |
| 2022 | $7,636 | $150,647 | $112,651 | $37,996 |
| 2021 | $7,707 | $150,650 | $112,650 | $38,000 |
| 2020 | $8,053 | $144,670 | $112,650 | $32,020 |
| 2019 | $8,279 | $144,670 | $112,650 | $32,020 |
| 2018 | $8,288 | $144,670 | $112,650 | $32,020 |
| 2017 | $8,938 | $155,510 | $112,650 | $42,860 |
| 2016 | $8,933 | $155,510 | $112,650 | $42,860 |
| 2015 | $7,429 | $155,510 | $112,650 | $42,860 |
| 2014 | $7,385 | $155,510 | $112,650 | $42,860 |
| 2013 | $3,654 | $155,510 | $112,650 | $42,860 |
Source: Public Records
Map
Nearby Homes
- 1711 Willow Dr
- 4 Curran St
- 3 Curran St
- 444 Hasting Dr
- 1035 1st St
- 430 E Adams St
- 1131 5th St
- 403 E Adams St
- 1002 Sycamore Line
- 1003 5th St
- 1648 Oakmont Ln
- 81 Marina Point Dr
- 89 Marina Point Dr
- 1117 Ogontz St
- 57 Marina Point Dr
- 49 Marina Point Dr
- 32 Marina Point Dr
- 1418 E Larchmont Dr
- 1034 Warren St
- 527 Hancock St
- 2243 Cedar Point Rd
- 2267 Cedar Point Rd
- 2241 Cedar Point Rd
- 2231 Cedar Point Rd
- 2211 Cedar Point Rd
- 2201 Cedar Point Rd
- 2177 Cedar Point Rd
- 2167 Cedar Point Rd
- 2167 Cedar Point Chaussee
- 2157 Cedar Point Rd
- 2157 Cedar Point Dr
- 2147 Cedar Point Rd
- 2137 Cedar Point Rd
- 2137 Cedar Point Dr
- 2109 Cedar Point Rd
- 2037 Cedar Point Rd
- 2035 Cedar Point Rd
- 2035 Cedar Point Rd
- 2033 Cedar Point Rd
- 2029 Cedar Point Rd
Your Personal Tour Guide
Ask me questions while you tour the home.