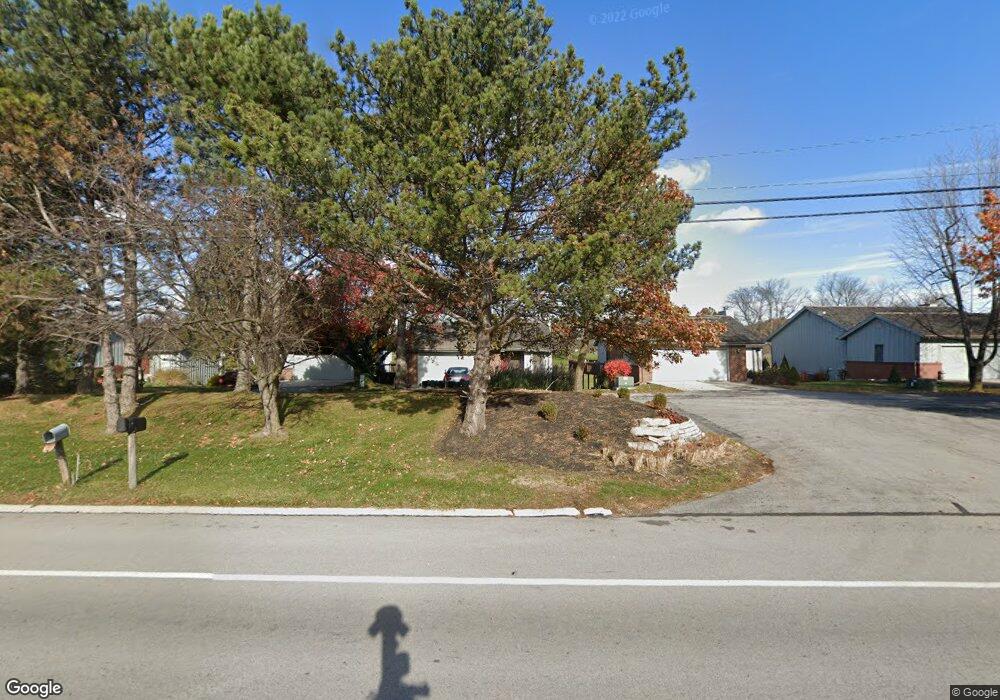
2254 E State St Unit 2254 Fremont, OH 43420
Estimated Value: $279,000 - $306,000
3
Beds
3
Baths
2,054
Sq Ft
$142/Sq Ft
Est. Value
About This Home
This home is located at 2254 E State St Unit 2254, Fremont, OH 43420 and is currently estimated at $292,179, approximately $142 per square foot. 2254 E State St Unit 2254 is a home located in Sandusky County with nearby schools including Fremont Ross High School, Temple Christian Academy, and Sacred Heart School.
Ownership History
Date
Name
Owned For
Owner Type
Purchase Details
Closed on
Oct 26, 2020
Sold by
Clay Joel D and Clay Judith M
Bought by
Clay Joel D and Clay Judith M
Current Estimated Value
Home Financials for this Owner
Home Financials are based on the most recent Mortgage that was taken out on this home.
Original Mortgage
$88,500
Outstanding Balance
$48,806
Interest Rate
2.8%
Mortgage Type
New Conventional
Estimated Equity
$243,373
Purchase Details
Closed on
Oct 22, 2010
Sold by
Peterson Andrew A and Peterson Emily L
Bought by
Clay Joel D
Home Financials for this Owner
Home Financials are based on the most recent Mortgage that was taken out on this home.
Original Mortgage
$150,000
Interest Rate
4.3%
Mortgage Type
New Conventional
Purchase Details
Closed on
Jun 6, 2000
Sold by
Simonton Nancy R
Bought by
Peterson Andrew A
Home Financials for this Owner
Home Financials are based on the most recent Mortgage that was taken out on this home.
Original Mortgage
$154,800
Interest Rate
8.18%
Mortgage Type
New Conventional
Purchase Details
Closed on
Jun 1, 1991
Sold by
Peterson Andrew A
Bought by
Clay Joel D
Purchase Details
Closed on
May 1, 1986
Bought by
Clay Joel D
Create a Home Valuation Report for This Property
The Home Valuation Report is an in-depth analysis detailing your home's value as well as a comparison with similar homes in the area
Home Values in the Area
Average Home Value in this Area
Purchase History
| Date | Buyer | Sale Price | Title Company |
|---|---|---|---|
| Clay Joel D | -- | None Available | |
| Clay Joel D | $188,500 | First American | |
| Peterson Andrew A | $172,000 | -- | |
| Clay Joel D | -- | -- | |
| Clay Joel D | $127,500 | -- |
Source: Public Records
Mortgage History
| Date | Status | Borrower | Loan Amount |
|---|---|---|---|
| Open | Clay Joel D | $88,500 | |
| Closed | Clay Joel D | $150,000 | |
| Previous Owner | Peterson Andrew A | $154,800 |
Source: Public Records
Tax History
| Year | Tax Paid | Tax Assessment Tax Assessment Total Assessment is a certain percentage of the fair market value that is determined by local assessors to be the total taxable value of land and additions on the property. | Land | Improvement |
|---|---|---|---|---|
| 2024 | $3,184 | $85,340 | $14,040 | $71,300 |
| 2023 | $3,318 | $72,310 | $11,900 | $60,410 |
| 2022 | $3,094 | $72,310 | $11,900 | $60,410 |
| 2021 | $2,860 | $72,310 | $11,900 | $60,410 |
| 2020 | $2,860 | $65,520 | $11,900 | $53,620 |
| 2019 | $2,857 | $65,520 | $11,900 | $53,620 |
| 2018 | $2,780 | $65,520 | $11,900 | $53,620 |
| 2017 | $2,686 | $62,970 | $11,900 | $51,070 |
| 2016 | $2,354 | $62,970 | $11,900 | $51,070 |
| 2015 | $2,317 | $62,970 | $11,900 | $51,070 |
| 2014 | $2,447 | $63,710 | $12,150 | $51,560 |
| 2013 | $2,395 | $63,710 | $12,150 | $51,560 |
Source: Public Records
Map
Nearby Homes
- 251 Ethan Dr
- 319 Caleb Dr
- 2112 Pinehurst Trail
- 318 Ethan Dr
- 226 Myah Dr
- 1533 Greenfield Ct
- 507 Oaklawn Ave
- 411 S Collinwood Blvd
- 925 Woodland St
- 0 S Buchanan St
- 805 Harmon St
- 322 4th St
- 314 N Ohio Ave
- 340 340 Sandusky Ave
- 208 E State St
- 224 Sandusky Ave Unit 226
- 711 Bloom Rd
- 1250 Morrison Rd
- 515 S Arch St
- 320 Tiffin St
- 2260 E State St
- 2240 E State St
- 2266 E State St
- 2226 E State St
- 2268 E State St
- 2218 E State St
- 2276 E State St
- 2210 E State St
- 2269 E State St
- 121 Norbert Dr
- 2247 E State St Unit 22
- 516 Timpe Rd
- 2215 E State St
- 101 Norbert Dr
- 526 Timpe Rd
- 135 Norbert Dr
- 515 Timpe Rd
- 147 Norbert Dr
- 600 Timpe Rd
- 153 Norbert Dr
Your Personal Tour Guide
Ask me questions while you tour the home.