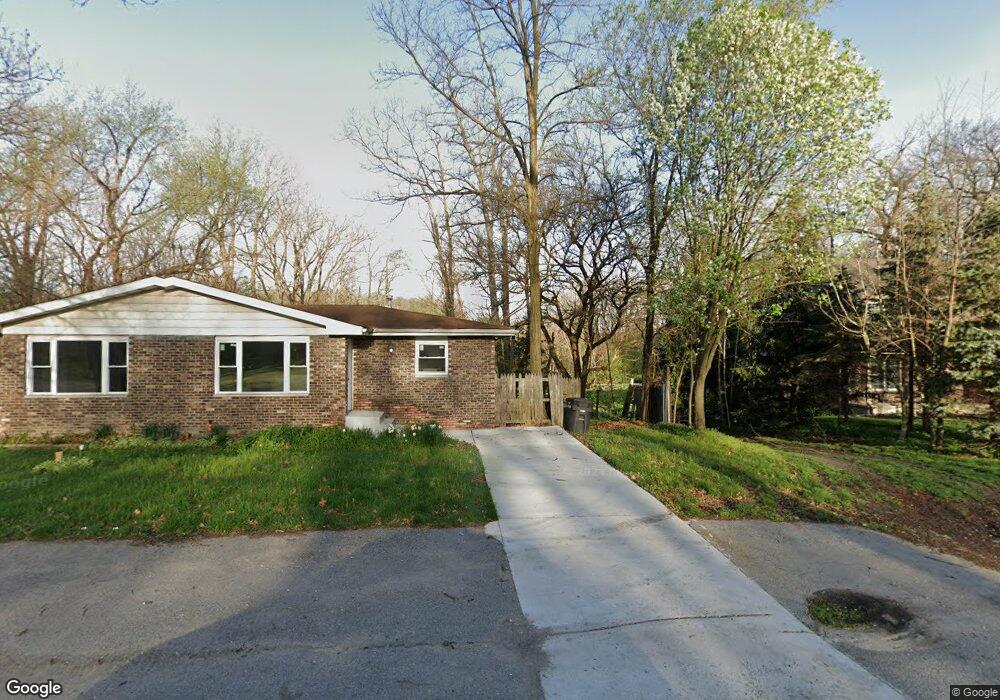
2254 Swanson Rd Portage, IN 46368
Estimated Value: $199,000 - $378,000
2
Beds
1
Bath
872
Sq Ft
$292/Sq Ft
Est. Value
About This Home
This home is located at 2254 Swanson Rd, Portage, IN 46368 and is currently estimated at $254,192, approximately $291 per square foot. 2254 Swanson Rd is a home located in Porter County with nearby schools including Crisman Elementary School, William Fegely Middle School, and Portage High School.
Ownership History
Date
Name
Owned For
Owner Type
Purchase Details
Closed on
Mar 25, 2025
Sold by
Garza Sandra
Bought by
Lowther Alexander J and Lowther Amber L
Current Estimated Value
Home Financials for this Owner
Home Financials are based on the most recent Mortgage that was taken out on this home.
Original Mortgage
$387,845
Outstanding Balance
$385,860
Interest Rate
6.87%
Mortgage Type
FHA
Estimated Equity
-$131,668
Purchase Details
Closed on
Jun 25, 2021
Sold by
Preffered Homes Llc
Bought by
Garza Sandra
Purchase Details
Closed on
Apr 28, 2021
Sold by
Five Stream Ventures Llc
Bought by
Preferred Homes Llc
Purchase Details
Closed on
Mar 26, 2019
Sold by
Mead Marilyn K and Woods Marilyn K
Bought by
Newbert Jake Allyn
Purchase Details
Closed on
Mar 19, 2019
Sold by
Skinner Timothy E
Bought by
Mead Marilyn K and Woods Marilyn K
Create a Home Valuation Report for This Property
The Home Valuation Report is an in-depth analysis detailing your home's value as well as a comparison with similar homes in the area
Home Values in the Area
Average Home Value in this Area
Purchase History
| Date | Buyer | Sale Price | Title Company |
|---|---|---|---|
| Lowther Alexander J | $395,000 | Fidelity National Title | |
| Garza Sandra | -- | Barrister Title | |
| Preferred Homes Llc | -- | None Available | |
| Five Stream Ventures Llc | -- | None Listed On Document | |
| Newbert Jake Allyn | $52,500 | -- | |
| Mead Marilyn K | -- | None Available |
Source: Public Records
Mortgage History
| Date | Status | Borrower | Loan Amount |
|---|---|---|---|
| Open | Lowther Alexander J | $387,845 |
Source: Public Records
Tax History Compared to Growth
Tax History
| Year | Tax Paid | Tax Assessment Tax Assessment Total Assessment is a certain percentage of the fair market value that is determined by local assessors to be the total taxable value of land and additions on the property. | Land | Improvement |
|---|---|---|---|---|
| 2024 | $5,283 | $118,400 | $32,200 | $86,200 |
| 2023 | $2,282 | $114,100 | $30,500 | $83,600 |
| 2022 | $2,330 | $116,500 | $30,500 | $86,000 |
| 2021 | $2,210 | $108,500 | $30,500 | $78,000 |
| 2020 | $3,615 | $95,800 | $27,800 | $68,000 |
| 2019 | $1,956 | $95,800 | $27,800 | $68,000 |
| 2018 | $1,884 | $92,200 | $27,800 | $64,400 |
| 2017 | $1,936 | $92,600 | $27,800 | $64,800 |
| 2016 | $1,832 | $89,600 | $26,800 | $62,800 |
| 2014 | $1,830 | $89,500 | $26,900 | $62,600 |
| 2013 | -- | $84,500 | $26,900 | $57,600 |
Source: Public Records
Map
Nearby Homes
- 5503 Clem Rd
- 5520 Clem Rd
- 2418 Peach St
- 5418 Clem Rd
- 5412 Clem Rd
- 2471 Woodward St
- 2565 Charles St
- 5857 Evergreen Ave
- 5300 Lyndell Ave
- 5294 Lyndell Ave
- 5288 Willow Ave
- Lot Evergreen Ave
- 2333 Locust St
- 2312 Locust St
- 5630 Mulberry Ave
- 2086 Bluebird Ct
- 5426 Mulberry Ave
- 5272 Concord Ave
- 6170 Lakewood Ave
- 6184 Lakewood Ave
- 2254 Swanson Rd Unit 56
- 2256 Swanson Rd
- 2262 Swanson Rd Unit 64
- 2250 Swanson Rd
- 2270 Swanson Rd
- 2261 Swanson Rd
- 2242 Swanson Rd
- 2280 Swanson Rd
- 2278 Swanson Rd
- 2278-80 Swanson Rd
- 2275 Swanson Rd Unit 77
- 2271 Swanson Rd
- 2234 Swanson Rd
- 2286 Swanson Rd Unit 88
- 2231 Swanson Rd
- 2257 Swanson Rd
- 2283 Swanson Rd Unit 85
- 2226 Swanson Rd
- 5641 Flower Ave
- 2243 Swanson Rd