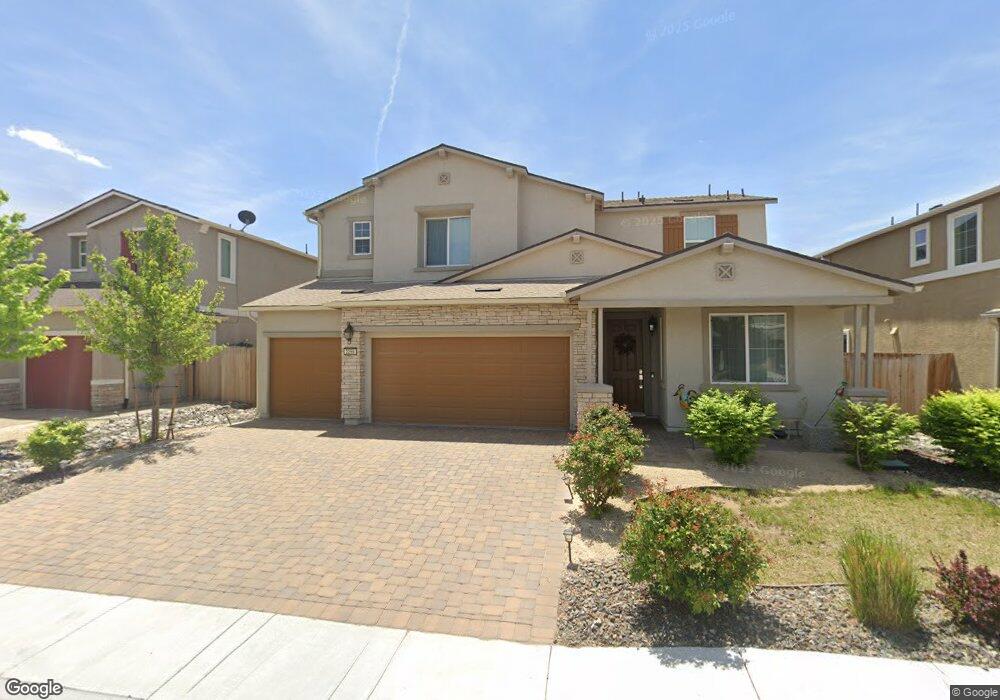
2255 Selway Dr Unit Lot 73 Sparks, NV 89436
Stonebrook NeighborhoodEstimated Value: $683,000 - $726,238
4
Beds
3
Baths
2,604
Sq Ft
$271/Sq Ft
Est. Value
About This Home
This home is located at 2255 Selway Dr Unit Lot 73, Sparks, NV 89436 and is currently estimated at $706,310, approximately $271 per square foot. 2255 Selway Dr Unit Lot 73 is a home located in Washoe County with nearby schools including Spanish Springs High School and Pinecrest Academy of Northern Nevada.
Ownership History
Date
Name
Owned For
Owner Type
Purchase Details
Closed on
Jul 14, 2021
Sold by
Stroman David A and Sawalka Hala
Bought by
Reyes Sanchez Miguel Angel and Reyes Paola Rosario
Current Estimated Value
Home Financials for this Owner
Home Financials are based on the most recent Mortgage that was taken out on this home.
Original Mortgage
$548,250
Outstanding Balance
$497,452
Interest Rate
2.9%
Mortgage Type
New Conventional
Estimated Equity
$208,858
Purchase Details
Closed on
Nov 18, 2019
Sold by
Toll Nv Limited Partnership
Bought by
Stroman David A and Sawalka Hala
Home Financials for this Owner
Home Financials are based on the most recent Mortgage that was taken out on this home.
Original Mortgage
$455,995
Interest Rate
3.7%
Mortgage Type
New Conventional
Create a Home Valuation Report for This Property
The Home Valuation Report is an in-depth analysis detailing your home's value as well as a comparison with similar homes in the area
Home Values in the Area
Average Home Value in this Area
Purchase History
| Date | Buyer | Sale Price | Title Company |
|---|---|---|---|
| Reyes Sanchez Miguel Angel | $690,000 | First Centennial Reno | |
| Stroman David A | $479,995 | Westminster Title Agency Inc |
Source: Public Records
Mortgage History
| Date | Status | Borrower | Loan Amount |
|---|---|---|---|
| Open | Reyes Sanchez Miguel Angel | $548,250 | |
| Previous Owner | Stroman David A | $455,995 |
Source: Public Records
Tax History Compared to Growth
Tax History
| Year | Tax Paid | Tax Assessment Tax Assessment Total Assessment is a certain percentage of the fair market value that is determined by local assessors to be the total taxable value of land and additions on the property. | Land | Improvement |
|---|---|---|---|---|
| 2025 | $5,889 | $193,690 | $41,930 | $151,760 |
| 2024 | $5,889 | $192,747 | $40,950 | $151,797 |
| 2023 | $5,713 | $183,694 | $40,740 | $142,954 |
| 2022 | $5,539 | $150,866 | $32,725 | $118,141 |
| 2021 | $5,286 | $144,839 | $27,825 | $117,014 |
| 2020 | $5,129 | $144,423 | $27,860 | $116,563 |
| 2019 | $2,384 | $64,798 | $11,375 | $53,423 |
| 2018 | $424 | $11,375 | $11,375 | $0 |
Source: Public Records
Map
Nearby Homes
- 2252 Selway Dr
- 2248 Musselshell Dr
- 2151 Roaring Fork Ct
- 2182 Butte Creek Dr
- 2144 Musselshell Ct
- 2449 Butte Creek Dr
- 2444 Butte Creek Dr
- 7819 Tarkio Ct
- 7731 Lampasas Dr
- 7681 Navasota Dr
- 8044 Miramar Ct
- 1920 Gold Feldspar Dr
- 1963 Red Loam Rd
- 2186 High Lake St
- 2137 High Lake St
- 2187 High Lake St
- 2187 High Lake St Unit Sage Meadow 109
- 7586 Evans Bridge St
- Denison Plan at Regency at Stonebrook - Sage Meadow Collection
- Makenna Plan at Regency at Stonebrook - Oakhill Collection
- 2255 Selway Dr
- 2255 Selway Dr Unit Homesite 73
- 2265 Selway Dr Unit Homesite 74
- 2265 Selway Dr Unit Lot 74
- 2265 Selway Dr
- 2245 Selway Dr
- 2238 Musselshell Dr
- 2235 Selway Dr
- 2258 Musselshell Dr
- 2275 Selway Dr
- 2228 Musselshell Dr
- 2262 Selway Dr Unit Homesite 102
- 2262 Selway Dr Unit Lot 102
- 2262 Selway Dr
- 2242 Selway Dr Unit Homesite 100
- 2242 Selway Dr Unit Lot 100
- 2242 Selway Dr
- 2225 Selway Dr Unit Homesite 70
- 2285 Selway Dr Unit Homesite 76
- 2285 Selway Dr Unit Lot 76