Estimated Value: $395,000 - $471,000
5
Beds
3
Baths
2,128
Sq Ft
$201/Sq Ft
Est. Value
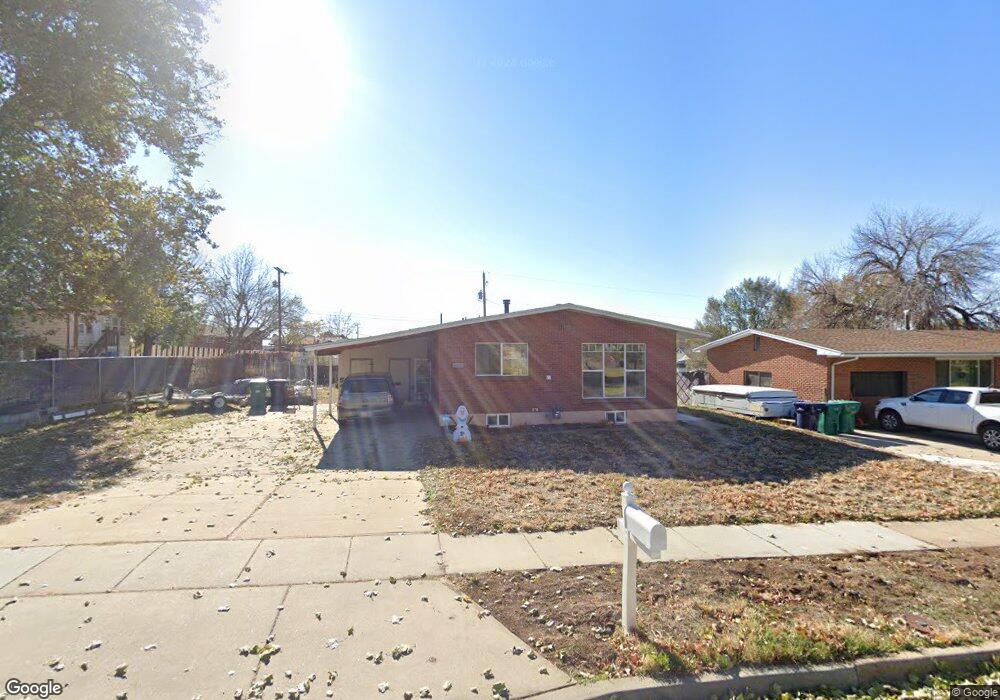
About This Home
This home is located at 2255 W 5900 S, Roy, UT 84067 and is currently estimated at $428,223, approximately $201 per square foot. 2255 W 5900 S is a home located in Weber County with nearby schools including Municipal School, Roy Junior High School, and Roy High School.
Ownership History
Date
Name
Owned For
Owner Type
Purchase Details
Closed on
Nov 8, 2021
Sold by
Christopher Sanchez
Bought by
Bailey Kurt and Bailey Kelsey L
Current Estimated Value
Home Financials for this Owner
Home Financials are based on the most recent Mortgage that was taken out on this home.
Original Mortgage
$368,600
Outstanding Balance
$338,039
Interest Rate
3.05%
Mortgage Type
New Conventional
Estimated Equity
$90,184
Purchase Details
Closed on
Apr 8, 2021
Sold by
Sanchez Christopher
Bought by
Sanchez Christopher and Sanchez Mariel Socorro
Home Financials for this Owner
Home Financials are based on the most recent Mortgage that was taken out on this home.
Original Mortgage
$324,022
Interest Rate
2.9%
Mortgage Type
FHA
Purchase Details
Closed on
May 3, 2018
Sold by
Jay Stephen C
Bought by
Sautter Catherime L
Home Financials for this Owner
Home Financials are based on the most recent Mortgage that was taken out on this home.
Original Mortgage
$156,834
Interest Rate
4.45%
Mortgage Type
VA
Create a Home Valuation Report for This Property
The Home Valuation Report is an in-depth analysis detailing your home's value as well as a comparison with similar homes in the area
Home Values in the Area
Average Home Value in this Area
Purchase History
| Date | Buyer | Sale Price | Title Company |
|---|---|---|---|
| Bailey Kurt | -- | Old Republic Title | |
| Sanchez Christopher | -- | Old Republic Title | |
| Sanchez Christopher | -- | Cottonwood Title | |
| Sautter Catherime L | -- | Backman Title Services Ltd |
Source: Public Records
Mortgage History
| Date | Status | Borrower | Loan Amount |
|---|---|---|---|
| Open | Bailey Kurt | $368,600 | |
| Previous Owner | Sanchez Christopher | $324,022 | |
| Previous Owner | Sautter Catherime L | $156,834 |
Source: Public Records
Tax History Compared to Growth
Tax History
| Year | Tax Paid | Tax Assessment Tax Assessment Total Assessment is a certain percentage of the fair market value that is determined by local assessors to be the total taxable value of land and additions on the property. | Land | Improvement |
|---|---|---|---|---|
| 2025 | $2,555 | $402,835 | $133,843 | $268,992 |
| 2024 | $2,511 | $219,449 | $73,622 | $145,827 |
| 2023 | $2,426 | $212,300 | $66,653 | $145,647 |
| 2022 | $2,436 | $219,450 | $57,335 | $162,115 |
| 2021 | $1,908 | $280,000 | $73,729 | $206,271 |
| 2020 | $1,801 | $243,000 | $73,729 | $169,271 |
| 2019 | $1,685 | $213,000 | $43,196 | $169,804 |
| 2018 | $1,563 | $185,000 | $41,160 | $143,840 |
| 2017 | $1,380 | $151,000 | $37,910 | $113,090 |
| 2016 | $1,324 | $77,832 | $18,410 | $59,422 |
| 2015 | $1,234 | $74,032 | $18,410 | $55,622 |
| 2014 | $1,244 | $74,032 | $18,410 | $55,622 |
Source: Public Records
Map
Nearby Homes