Estimated Value: $392,000 - $446,000
4
Beds
2
Baths
2,238
Sq Ft
$188/Sq Ft
Est. Value
About This Home
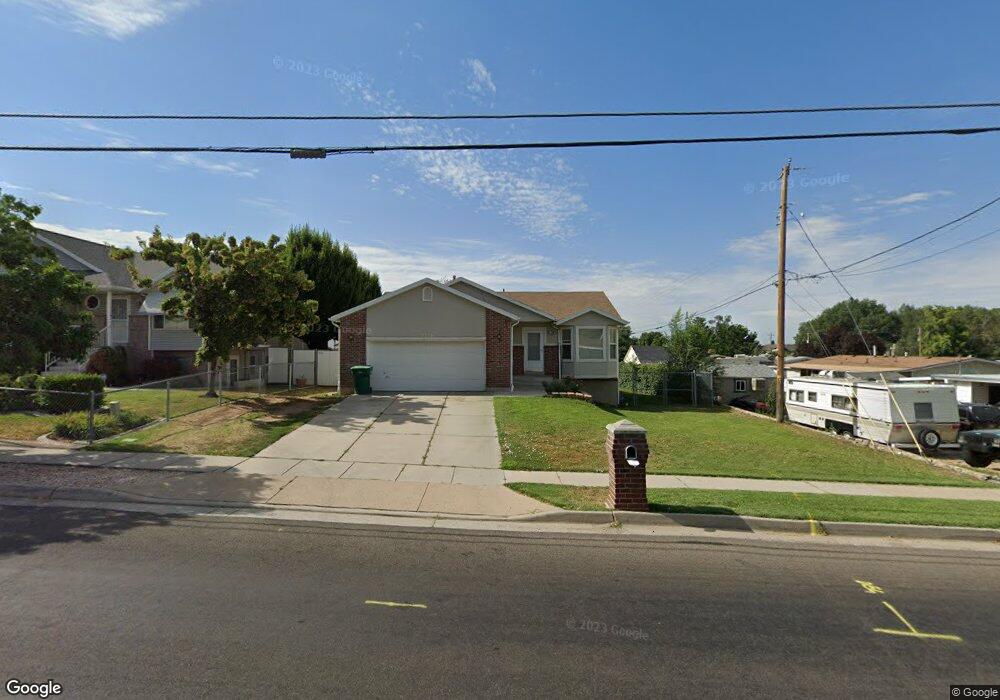
This home is located at 2255 W 6000 S, Roy, UT 84067 and is currently estimated at $421,576, approximately $188 per square foot. 2255 W 6000 S is a home located in Weber County with nearby schools including Municipal School, Roy Junior High School, and Roy High School.
Ownership History
Date
Name
Owned For
Owner Type
Purchase Details
Closed on
Jun 1, 2018
Sold by
Ellis Brian F
Bought by
Thomas Shaun
Current Estimated Value
Home Financials for this Owner
Home Financials are based on the most recent Mortgage that was taken out on this home.
Original Mortgage
$237,150
Outstanding Balance
$203,755
Interest Rate
4.4%
Mortgage Type
New Conventional
Estimated Equity
$217,821
Purchase Details
Closed on
Dec 2, 2013
Sold by
Ellis Brian
Bought by
Ellis Brain F
Home Financials for this Owner
Home Financials are based on the most recent Mortgage that was taken out on this home.
Original Mortgage
$147,300
Interest Rate
4.08%
Mortgage Type
New Conventional
Purchase Details
Closed on
Oct 1, 2007
Sold by
Brynjulfson Jennefer
Bought by
Ellis Brian
Home Financials for this Owner
Home Financials are based on the most recent Mortgage that was taken out on this home.
Original Mortgage
$154,000
Interest Rate
6.4%
Mortgage Type
Purchase Money Mortgage
Purchase Details
Closed on
Nov 17, 2005
Sold by
Ellis Brian F and Brynjulfson Jennefer M
Bought by
Ellis Brian and Brynjulfson Jennefer
Home Financials for this Owner
Home Financials are based on the most recent Mortgage that was taken out on this home.
Original Mortgage
$24,000
Interest Rate
5.48%
Mortgage Type
Stand Alone Second
Purchase Details
Closed on
Jun 8, 2004
Sold by
Olsen Zach M
Bought by
Ellis Brian F and Brynjulfson Jennefer M
Purchase Details
Closed on
Apr 5, 1999
Sold by
Messerly John
Bought by
Olsen Zach M and Olsen Julie A
Home Financials for this Owner
Home Financials are based on the most recent Mortgage that was taken out on this home.
Original Mortgage
$104,000
Interest Rate
6.91%
Purchase Details
Closed on
Oct 21, 1998
Sold by
Hillside Llc
Bought by
Messerly John
Home Financials for this Owner
Home Financials are based on the most recent Mortgage that was taken out on this home.
Original Mortgage
$101,000
Interest Rate
6.71%
Create a Home Valuation Report for This Property
The Home Valuation Report is an in-depth analysis detailing your home's value as well as a comparison with similar homes in the area
Home Values in the Area
Average Home Value in this Area
Purchase History
| Date | Buyer | Sale Price | Title Company |
|---|---|---|---|
| Thomas Shaun | -- | Old Republic Title | |
| Ellis Brain F | -- | Hickman Land Title Co | |
| Ellis Brian | -- | First American Riverdale | |
| Ellis Brian | -- | First American Title | |
| Ellis Brian F | -- | Backman Stewart Title | |
| Ellis Brian F | -- | Backman Stewart Title | |
| Olsen Zach M | -- | Mountain View Title | |
| Messerly John | -- | Superior Title Company |
Source: Public Records
Mortgage History
| Date | Status | Borrower | Loan Amount |
|---|---|---|---|
| Open | Thomas Shaun | $237,150 | |
| Previous Owner | Ellis Brain F | $147,300 | |
| Previous Owner | Ellis Brian | $154,000 | |
| Previous Owner | Ellis Brian | $24,000 | |
| Previous Owner | Ellis Brian | $128,000 | |
| Previous Owner | Olsen Zach M | $104,000 | |
| Previous Owner | Messerly John | $101,000 | |
| Closed | Messerly John | $14,000 |
Source: Public Records
Tax History
| Year | Tax Paid | Tax Assessment Tax Assessment Total Assessment is a certain percentage of the fair market value that is determined by local assessors to be the total taxable value of land and additions on the property. | Land | Improvement |
|---|---|---|---|---|
| 2025 | $2,610 | $413,569 | $103,234 | $310,335 |
| 2024 | $2,544 | $223,299 | $56,778 | $166,521 |
| 2023 | $2,408 | $211,200 | $57,059 | $154,141 |
| 2022 | $2,297 | $206,250 | $50,026 | $156,224 |
| 2021 | $2,028 | $301,000 | $63,306 | $237,694 |
| 2020 | $1,875 | $255,000 | $63,306 | $191,694 |
| 2019 | $1,862 | $239,000 | $40,413 | $198,587 |
| 2018 | $1,759 | $212,000 | $36,727 | $175,273 |
| 2017 | $1,635 | $184,000 | $36,727 | $147,273 |
| 2016 | $1,549 | $93,460 | $20,466 | $72,994 |
| 2015 | $1,273 | $76,942 | $19,401 | $57,541 |
| 2014 | $1,248 | $74,494 | $19,401 | $55,093 |
Source: Public Records
Map
Nearby Homes
Your Personal Tour Guide
Ask me questions while you tour the home.