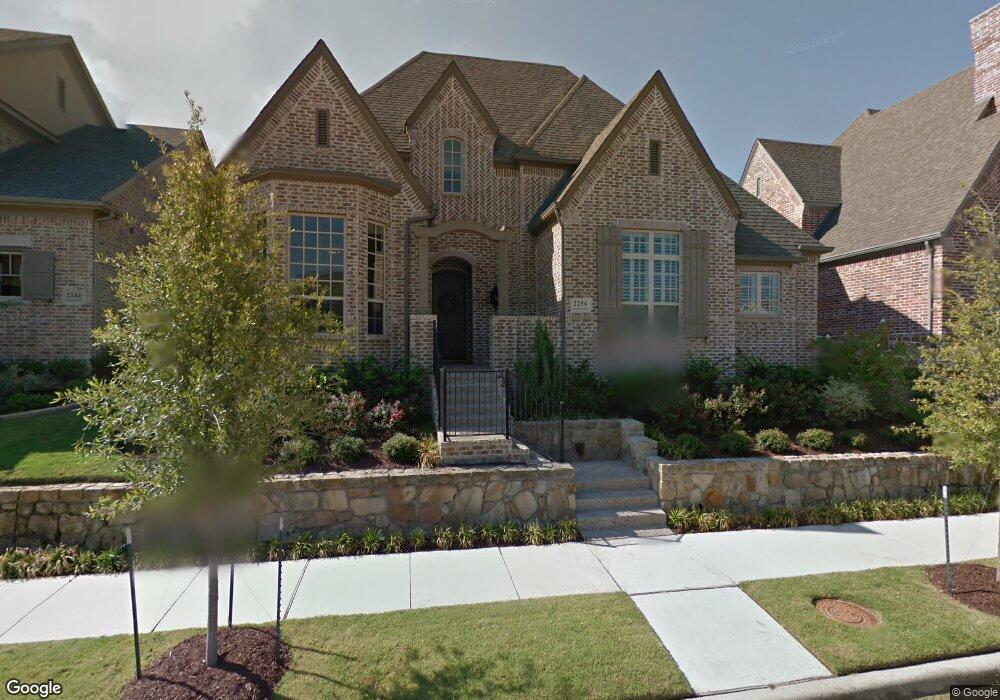
2256 Cardinal Blvd Carrollton, TX 75010
Austin Ranch NeighborhoodEstimated Value: $973,666 - $1,076,000
5
Beds
6
Baths
4,381
Sq Ft
$232/Sq Ft
Est. Value
About This Home
This home is located at 2256 Cardinal Blvd, Carrollton, TX 75010 and is currently estimated at $1,014,417, approximately $231 per square foot. 2256 Cardinal Blvd is a home located in Denton County with nearby schools including Arbor Creek Middle School, Hebron High School, and Prestonwood Christian Academy.
Ownership History
Date
Name
Owned For
Owner Type
Purchase Details
Closed on
Nov 15, 2019
Sold by
Akbany Adam I and Akbany Tracy L
Bought by
Cooper Brock A and Cooper Kimberley K
Current Estimated Value
Home Financials for this Owner
Home Financials are based on the most recent Mortgage that was taken out on this home.
Original Mortgage
$536,000
Outstanding Balance
$472,011
Interest Rate
3.65%
Mortgage Type
New Conventional
Estimated Equity
$542,406
Purchase Details
Closed on
Aug 24, 2010
Sold by
Highland Homes Ltd
Bought by
Akbany Adam I and Akbany Tracy L
Home Financials for this Owner
Home Financials are based on the most recent Mortgage that was taken out on this home.
Original Mortgage
$380,487
Interest Rate
4.6%
Mortgage Type
New Conventional
Purchase Details
Closed on
Apr 9, 2010
Sold by
Austin Waters Development Llc
Bought by
Highland Homes Ltd
Create a Home Valuation Report for This Property
The Home Valuation Report is an in-depth analysis detailing your home's value as well as a comparison with similar homes in the area
Home Values in the Area
Average Home Value in this Area
Purchase History
| Date | Buyer | Sale Price | Title Company |
|---|---|---|---|
| Cooper Brock A | -- | Rtt | |
| Akbany Adam I | -- | None Available | |
| Highland Homes Ltd | -- | Ortc |
Source: Public Records
Mortgage History
| Date | Status | Borrower | Loan Amount |
|---|---|---|---|
| Open | Cooper Brock A | $536,000 | |
| Previous Owner | Akbany Adam I | $380,487 |
Source: Public Records
Tax History Compared to Growth
Tax History
| Year | Tax Paid | Tax Assessment Tax Assessment Total Assessment is a certain percentage of the fair market value that is determined by local assessors to be the total taxable value of land and additions on the property. | Land | Improvement |
|---|---|---|---|---|
| 2025 | $13,423 | $925,029 | $201,600 | $781,743 |
| 2024 | $15,510 | $840,935 | $0 | $0 |
| 2023 | $12,193 | $764,486 | $201,600 | $684,666 |
| 2022 | $14,017 | $694,987 | $201,600 | $604,014 |
| 2021 | $13,646 | $631,806 | $129,600 | $502,206 |
| 2020 | $13,415 | $623,147 | $129,600 | $493,547 |
| 2019 | $14,089 | $632,350 | $129,600 | $502,750 |
| 2018 | $13,744 | $612,204 | $129,600 | $482,604 |
| 2017 | $13,430 | $591,059 | $104,184 | $486,875 |
| 2016 | $12,215 | $537,588 | $104,184 | $433,404 |
| 2015 | $10,613 | $517,939 | $104,184 | $413,755 |
| 2014 | $10,613 | $483,342 | $104,184 | $379,158 |
| 2013 | -- | $476,708 | $104,184 | $372,524 |
Source: Public Records
Map
Nearby Homes
- 4904 Sage Hill Dr
- 4940 Sage Hill Dr
- 2301 Cardinal Blvd
- 2424 Cardinal Blvd
- 2220 Emerson Ln
- 2212 Gatsby Way
- 2173 Balcones Dr
- 2165 Balcones Dr
- 2409 Valley Ln
- 4100 Plano Pkwy
- 2257 Lobo Ln
- 2281 Madison St
- 4740 Alexander Dr
- 4836 Paddock Trail
- 2265 Madison St
- 5888 Austin Waters
- 2317 Connor Way
- 2269 Washington Dr
- 5876 Austin Waters
- 3009 Bonsai Dr
- 2260 Cardinal Blvd
- 2252 Cardinal Blvd
- 2300 Cardinal Blvd
- 2248 Cardinal Blvd
- 2237 Longwood Dr
- 2233 Longwood Dr
- 2241 Longwood Dr
- 2229 Longwood Dr
- 2245 Longwood Dr
- 2225 Longwood Dr
- 2244 Cardinal Blvd
- 2249 Longwood Dr
- 2221 Longwood Dr
- 2304 Cardinal Blvd
- 2217 Longwood Dr
- 2261 Cardinal Blvd
- 2257 Cardinal Blvd
- 2257 Longwood Dr
- 2213 Longwood Dr
- 2253 Cardinal Blvd