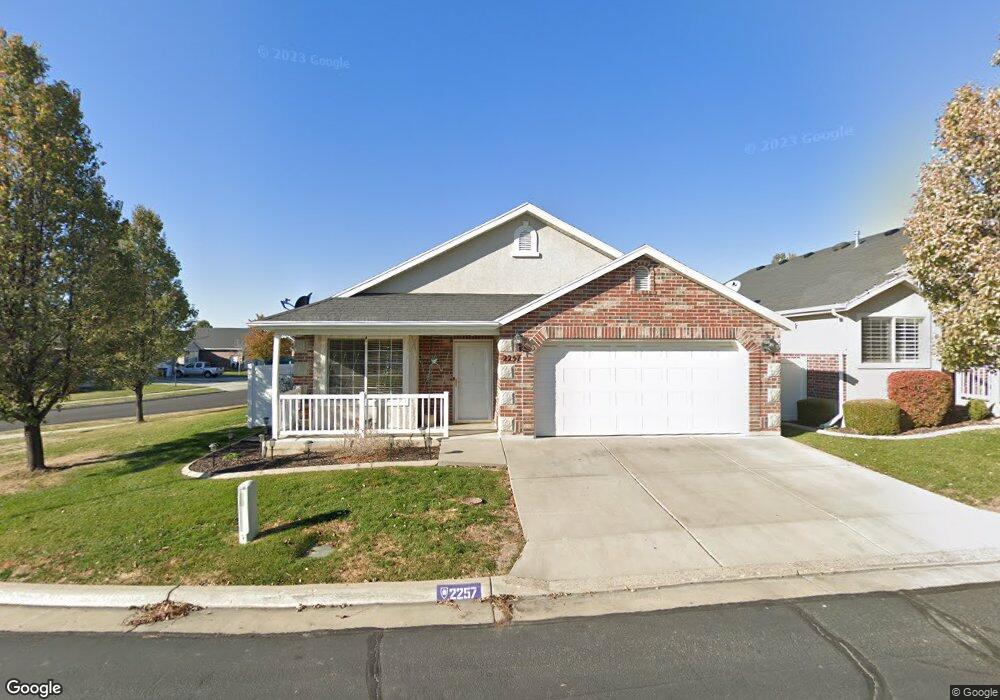
2257 N 1085 W Layton, UT 84041
Estimated Value: $449,000 - $521,000
3
Beds
2
Baths
1,538
Sq Ft
$310/Sq Ft
Est. Value
About This Home
This home is located at 2257 N 1085 W, Layton, UT 84041 and is currently estimated at $477,060, approximately $310 per square foot. 2257 N 1085 W is a home located in Davis County with nearby schools including Lincoln Elementary School, North Layton Junior High School, and Northridge High School.
Ownership History
Date
Name
Owned For
Owner Type
Purchase Details
Closed on
Jun 30, 2016
Sold by
Simpson Brent J
Bought by
Cunning Norman and Cunning Living Trust
Current Estimated Value
Purchase Details
Closed on
Jun 12, 2008
Sold by
Simpson Ione Johnson
Bought by
Simpson Ione J and Ione J Simpson 1997 Family Trust
Home Financials for this Owner
Home Financials are based on the most recent Mortgage that was taken out on this home.
Original Mortgage
$190,400
Interest Rate
6.05%
Mortgage Type
Purchase Money Mortgage
Purchase Details
Closed on
Jun 11, 2008
Sold by
Lindberg Vernal M and Lindberg Donna Lue
Bought by
Simpson Ione Johnson
Home Financials for this Owner
Home Financials are based on the most recent Mortgage that was taken out on this home.
Original Mortgage
$190,400
Interest Rate
6.05%
Mortgage Type
Purchase Money Mortgage
Purchase Details
Closed on
Oct 31, 2006
Sold by
Colonial Builders Group Llc
Bought by
Lindberg Vernal M and Lindberg Donna Lue
Create a Home Valuation Report for This Property
The Home Valuation Report is an in-depth analysis detailing your home's value as well as a comparison with similar homes in the area
Home Values in the Area
Average Home Value in this Area
Purchase History
| Date | Buyer | Sale Price | Title Company |
|---|---|---|---|
| Cunning Norman | -- | Northwest Title | |
| Simpson Ione J | -- | Lincoln Title Ins Agency | |
| Simpson Ione Johnson | -- | Inwest Title Services Inc | |
| Lindberg Vernal M | -- | Lincoln Title Ins Agency |
Source: Public Records
Mortgage History
| Date | Status | Borrower | Loan Amount |
|---|---|---|---|
| Previous Owner | Simpson Ione Johnson | $190,400 |
Source: Public Records
Tax History Compared to Growth
Tax History
| Year | Tax Paid | Tax Assessment Tax Assessment Total Assessment is a certain percentage of the fair market value that is determined by local assessors to be the total taxable value of land and additions on the property. | Land | Improvement |
|---|---|---|---|---|
| 2025 | $2,264 | $237,600 | $68,200 | $169,400 |
| 2024 | $2,179 | $230,451 | $49,638 | $180,813 |
| 2023 | $2,227 | $415,000 | $86,450 | $328,550 |
| 2022 | $2,331 | $235,951 | $43,368 | $192,583 |
| 2021 | $2,014 | $304,000 | $65,550 | $238,450 |
| 2020 | $1,802 | $261,000 | $48,450 | $212,550 |
| 2019 | $1,763 | $250,000 | $46,550 | $203,450 |
| 2018 | $1,622 | $231,000 | $49,000 | $182,000 |
| 2016 | $1,465 | $107,580 | $26,950 | $80,630 |
| 2015 | $1,461 | $100,870 | $26,950 | $73,920 |
| 2014 | $1,469 | $104,758 | $18,333 | $86,425 |
| 2013 | -- | $107,250 | $42,911 | $64,339 |
Source: Public Records
Map
Nearby Homes
- 2257 N 1085 W Unit 47
- 2265 N 1085 W Unit 48
- 2265 N 1085 W Unit 47
- 2265 N 1085 W
- 2262 Spring Creek Dr
- 2271 N 1085 W Unit 49
- 2271 N 1085 W Unit 48
- 2266 Spring Creek Dr
- 2260 N 1085 W Unit 44
- 2266 N 1085 W Unit 43
- 2281 N 1085 W Unit 50
- 1073 W 2250 N
- 2909 N 1150 W Unit 10D
- 1113 Spring Creek Dr
- 2278 N 1085 W Unit 42
- 1065 W 2250 N
- 1119 Spring Creek Dr
- 2284 Spring Creek Dr
- 2287 N 1085 W Unit 52
- 2287 N 1085 W