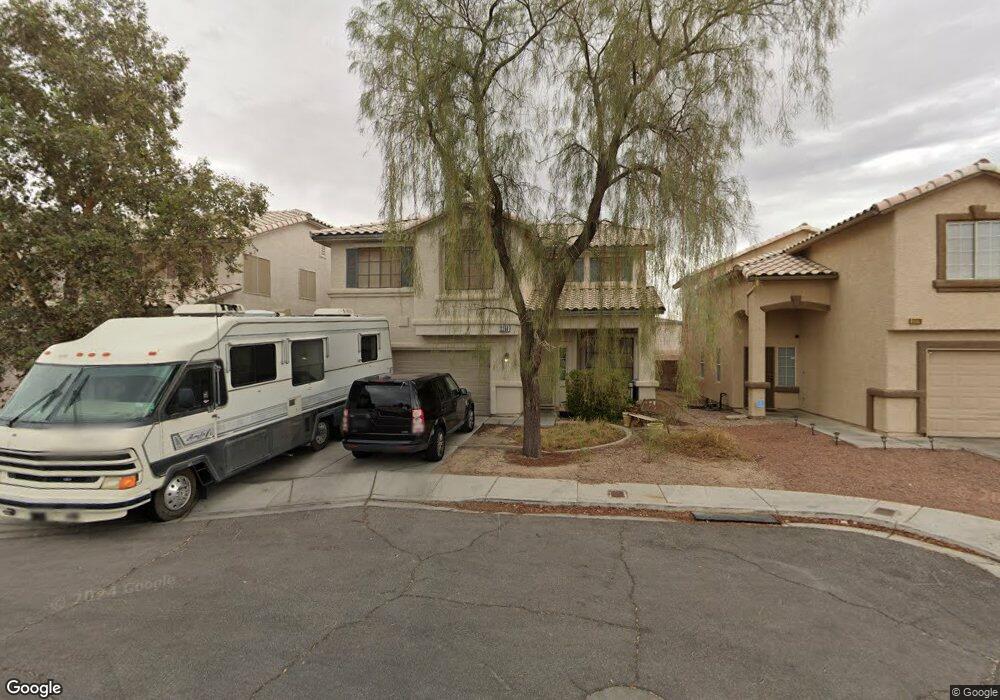
2258 Falling Rain Dr Las Vegas, NV 89142
Estimated Value: $429,908 - $454,000
4
Beds
3
Baths
1,989
Sq Ft
$222/Sq Ft
Est. Value
About This Home
This home is located at 2258 Falling Rain Dr, Las Vegas, NV 89142 and is currently estimated at $441,977, approximately $222 per square foot. 2258 Falling Rain Dr is a home located in Clark County with nearby schools including Dan Goldfarb Elementary School, Kathleen & Tim Harney Middle School, and Las Vegas High School.
Ownership History
Date
Name
Owned For
Owner Type
Purchase Details
Closed on
Dec 29, 2015
Sold by
Gay Jack E
Bought by
Gandy Sildem J
Current Estimated Value
Home Financials for this Owner
Home Financials are based on the most recent Mortgage that was taken out on this home.
Original Mortgage
$221,062
Outstanding Balance
$175,585
Interest Rate
3.92%
Mortgage Type
VA
Estimated Equity
$266,392
Purchase Details
Closed on
Sep 10, 1999
Sold by
Va
Bought by
Gay Jack E
Purchase Details
Closed on
Sep 8, 1999
Sold by
Gay Mary L
Bought by
Gay Jack E
Purchase Details
Closed on
Jan 26, 1999
Sold by
Shaw William M
Bought by
Chase Manhattan Mtg Corp
Purchase Details
Closed on
Jun 26, 1997
Sold by
Lewis Properties
Bought by
Shaw William M
Home Financials for this Owner
Home Financials are based on the most recent Mortgage that was taken out on this home.
Original Mortgage
$132,668
Interest Rate
7.91%
Mortgage Type
VA
Create a Home Valuation Report for This Property
The Home Valuation Report is an in-depth analysis detailing your home's value as well as a comparison with similar homes in the area
Home Values in the Area
Average Home Value in this Area
Purchase History
| Date | Buyer | Sale Price | Title Company |
|---|---|---|---|
| Gandy Sildem J | $214,000 | Equity Title Of Nevada | |
| Gay Jack E | -- | Equity Title Of Nevada | |
| Gay Jack E | -- | -- | |
| Gay Jack E | -- | -- | |
| Chase Manhattan Mtg Corp | $117,885 | Ati Title | |
| Shaw William M | $130,500 | United Title |
Source: Public Records
Mortgage History
| Date | Status | Borrower | Loan Amount |
|---|---|---|---|
| Open | Gandy Sildem J | $221,062 | |
| Previous Owner | Shaw William M | $132,668 |
Source: Public Records
Tax History Compared to Growth
Tax History
| Year | Tax Paid | Tax Assessment Tax Assessment Total Assessment is a certain percentage of the fair market value that is determined by local assessors to be the total taxable value of land and additions on the property. | Land | Improvement |
|---|---|---|---|---|
| 2025 | $5,666 | $91,809 | $24,850 | $66,959 |
| 2024 | $1,901 | $91,809 | $24,850 | $66,959 |
| 2023 | $1,901 | $92,397 | $28,700 | $63,697 |
| 2022 | $1,506 | $81,775 | $23,450 | $58,325 |
| 2021 | $1,394 | $77,014 | $21,350 | $55,664 |
| 2020 | $1,292 | $75,814 | $20,650 | $55,164 |
| 2019 | $1,211 | $72,159 | $17,850 | $54,309 |
| 2018 | $1,155 | $66,894 | $14,700 | $52,194 |
| 2017 | $1,943 | $66,264 | $13,300 | $52,964 |
| 2016 | $1,082 | $55,924 | $9,450 | $46,474 |
| 2015 | $1,079 | $45,911 | $8,050 | $37,861 |
| 2014 | $1,048 | $37,073 | $7,000 | $30,073 |
Source: Public Records
Map
Nearby Homes
- 2234 Falling Rain Dr
- 2097 Audrey Hepburn St
- 6275 Allspice Ct
- 6260 Peach Orchard Rd
- 2316 Tulip Field St
- 6233 Apple Orchard Dr
- 6311 American Beauty Ave
- 6170 E Sahara Ave Unit 1031
- 6170 E Sahara Ave Unit 1076
- 6131 Pumpkin Patch Ave
- 6587 Candy Apple Cir
- 2539 Early Light Dr
- 6384 Cornstalk Cir
- 6080 Saint Petersburg Dr
- 6223 E Sahara Ave Unit 137
- 6223 E Sahara Ave Unit 165
- 6223 E Sahara Ave Unit 167
- 6223 E Sahara Ave Unit 190
- 6223 E Sahara Ave Unit 81
- 6471 Dune Point Ct
- 2246 Falling Rain Dr
- 2270 Falling Rain Dr
- 2222 Falling Rain Dr
- 6371 Peach Orchard Rd
- 2271 Falling Rain Dr
- 2210 Falling Rain Dr
- 6363 Peach Orchard Rd
- 2198 Falling Rain Dr
- 6347 Peach Orchard Rd
- 6374 Peach Orchard Rd
- 2186 Falling Rain Dr
- 6341 Peach Orchard Rd
- 6368 Peach Orchard Rd
- 6362 Peach Orchard Rd
- 6335 Peach Orchard Rd
- 2160 Falling Rain Dr
- 6356 Peach Orchard Rd
- 6350 Peach Orchard Rd
- 6329 Peach Orchard Rd
- 6329 Peach Orchard Rd Unit n/a