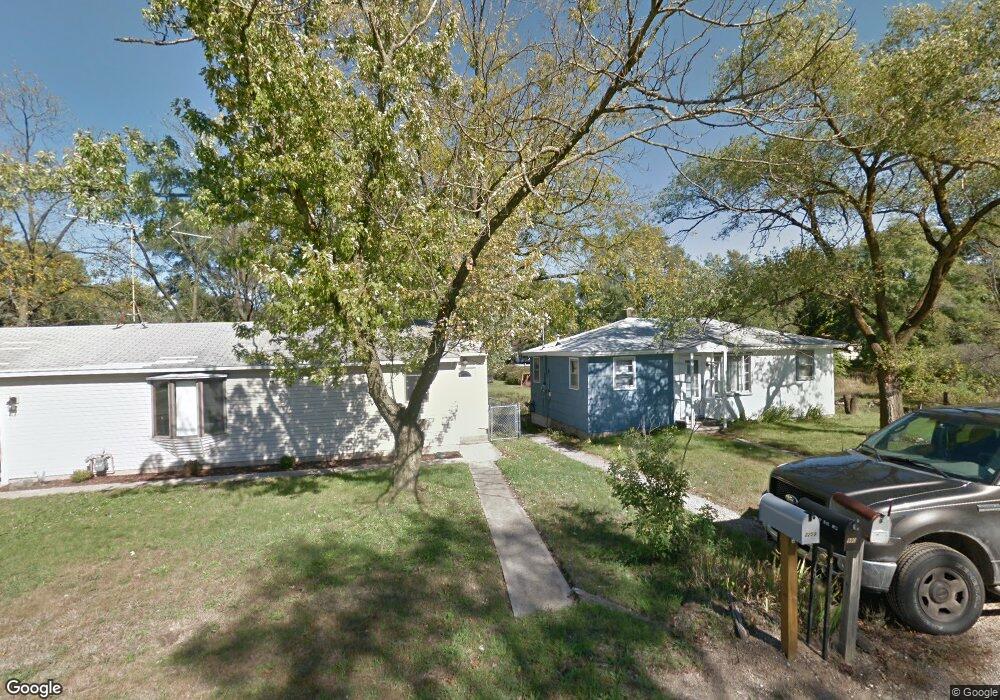
2258 Milton Ave Muskegon, MI 49442
Estimated Value: $129,000 - $181,000
2
Beds
1
Bath
674
Sq Ft
$222/Sq Ft
Est. Value
About This Home
This home is located at 2258 Milton Ave, Muskegon, MI 49442 and is currently estimated at $149,667, approximately $222 per square foot. 2258 Milton Ave is a home located in Muskegon County with nearby schools including Orchard View Early Elementary School, Cardinal Elementary School, and Orchard View Middle School.
Ownership History
Date
Name
Owned For
Owner Type
Purchase Details
Closed on
Mar 10, 2010
Sold by
Secretary Of Housing & Urban Development
Bought by
Nelson Richard A
Current Estimated Value
Purchase Details
Closed on
Nov 3, 2008
Sold by
Fifth Third Mortgage Company
Bought by
The Secretary Of Housing & Urban Develop
Purchase Details
Closed on
May 2, 2008
Sold by
Nichols Bruce
Bought by
Fifth Third Mortgage Co
Purchase Details
Closed on
Apr 16, 2005
Sold by
Nichols Bruce
Bought by
Nichols Bruce and Nichols Ruby A
Home Financials for this Owner
Home Financials are based on the most recent Mortgage that was taken out on this home.
Original Mortgage
$60,900
Interest Rate
5.89%
Mortgage Type
FHA
Purchase Details
Closed on
Apr 15, 2005
Sold by
Tierman Sharon A and Robinson Norma L
Bought by
Nichols Bruce
Home Financials for this Owner
Home Financials are based on the most recent Mortgage that was taken out on this home.
Original Mortgage
$60,900
Interest Rate
5.89%
Mortgage Type
FHA
Create a Home Valuation Report for This Property
The Home Valuation Report is an in-depth analysis detailing your home's value as well as a comparison with similar homes in the area
Home Values in the Area
Average Home Value in this Area
Purchase History
| Date | Buyer | Sale Price | Title Company |
|---|---|---|---|
| Nelson Richard A | $13,500 | None Available | |
| The Secretary Of Housing & Urban Develop | -- | Rei | |
| Fifth Third Mortgage Co | $62,773 | None Available | |
| Nichols Bruce | -- | -- | |
| Nichols Bruce | -- | -- |
Source: Public Records
Mortgage History
| Date | Status | Borrower | Loan Amount |
|---|---|---|---|
| Previous Owner | Nichols Bruce | $60,900 |
Source: Public Records
Tax History Compared to Growth
Tax History
| Year | Tax Paid | Tax Assessment Tax Assessment Total Assessment is a certain percentage of the fair market value that is determined by local assessors to be the total taxable value of land and additions on the property. | Land | Improvement |
|---|---|---|---|---|
| 2025 | $1,045 | $46,500 | $0 | $0 |
| 2024 | $213 | $43,100 | $0 | $0 |
| 2023 | $203 | $35,900 | $0 | $0 |
| 2022 | $953 | $30,800 | $0 | $0 |
| 2021 | $939 | $25,300 | $0 | $0 |
| 2020 | $918 | $23,900 | $0 | $0 |
| 2019 | $909 | $21,100 | $0 | $0 |
| 2018 | $864 | $19,100 | $0 | $0 |
| 2017 | $847 | $18,900 | $0 | $0 |
| 2016 | $173 | $17,400 | $0 | $0 |
| 2015 | -- | $16,500 | $0 | $0 |
| 2014 | -- | $15,300 | $0 | $0 |
| 2013 | -- | $14,500 | $0 | $0 |
Source: Public Records
Map
Nearby Homes
- 936 West St
- 1130 Center St
- 947 Carlton St
- 1051 West St
- 1190 Center St
- 687 S Sheridan Dr
- 640 West St
- 2435 Annette Ave
- 2028 Marcoux Ave
- 1937 E Isabella Ave
- 1059 Gordon St
- 1935 Catherine Ave
- 1885 E Isabella Ave
- 1972 Calvin Ave
- 2369 James Ave
- 2335 Vine Ave
- 470 S Sheridan Dr
- VL Quarterline Rd
- 1774 Mclaughlin Ave
- 2576 Vine Ave
- 2268 Milton Ave
- 2259 Madalene Ave
- 2247 Madalene Ave
- 2263 Madalene Ave
- 980 Shirley Blvd
- 2279 Madalene Ave
- 2285 Madalene Ave
- 2291 Madalene Ave
- 923 Shirley Blvd
- 2299 Madalene Ave
- 2260 Madalene Ave
- 2250 Madalene Ave
- 2270 Madalene Ave
- 2250 E Apple Ave
- 2307 Madalene Ave
- 2310 Milton Ave
- 2230 Madalene Ave
- 940 Center St
- 930 Center St
- 2288 Madalene Ave