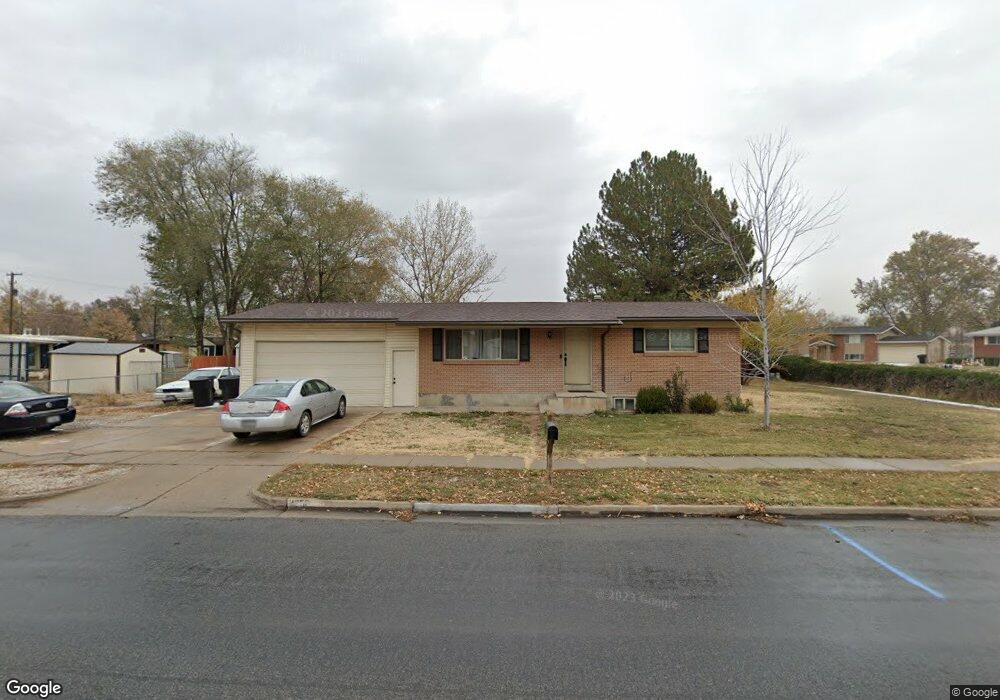
2258 N 630 W Clearfield, UT 84015
Estimated Value: $397,000 - $430,000
4
Beds
2
Baths
1,850
Sq Ft
$223/Sq Ft
Est. Value
About This Home
This home is located at 2258 N 630 W, Clearfield, UT 84015 and is currently estimated at $413,216, approximately $223 per square foot. 2258 N 630 W is a home located in Davis County with nearby schools including Fremont School, Sunset Junior High School, and Northridge High School.
Ownership History
Date
Name
Owned For
Owner Type
Purchase Details
Closed on
May 11, 2023
Sold by
Otuafi Samantha
Bought by
Otuafi Samantha Lisa
Current Estimated Value
Home Financials for this Owner
Home Financials are based on the most recent Mortgage that was taken out on this home.
Original Mortgage
$287,952
Outstanding Balance
$279,530
Interest Rate
6.32%
Mortgage Type
FHA
Estimated Equity
$133,686
Purchase Details
Closed on
Jun 13, 2018
Sold by
Albeman Ronald P
Bought by
Otuafi Samantha
Purchase Details
Closed on
Jul 21, 2011
Sold by
Mountain Prime Llc
Bought by
Ableman Ronald P
Home Financials for this Owner
Home Financials are based on the most recent Mortgage that was taken out on this home.
Original Mortgage
$5,300
Interest Rate
4.45%
Mortgage Type
Stand Alone Second
Purchase Details
Closed on
Apr 28, 2011
Sold by
Byington Wendell H
Bought by
Mountain Prime Llc
Home Financials for this Owner
Home Financials are based on the most recent Mortgage that was taken out on this home.
Original Mortgage
$55,000
Interest Rate
4.72%
Mortgage Type
Purchase Money Mortgage
Purchase Details
Closed on
May 1, 2010
Sold by
Byington Weldon D
Bought by
Byington Wendell H and Byington Erma R
Purchase Details
Closed on
Apr 29, 2010
Sold by
Byington Wendell H and Byington Erma
Bought by
Byington Weldon D
Purchase Details
Closed on
Dec 16, 2008
Sold by
The Byington Family Living Trust and Byington Wendell H
Bought by
Byington Erma R
Home Financials for this Owner
Home Financials are based on the most recent Mortgage that was taken out on this home.
Original Mortgage
$217,500
Interest Rate
5.14%
Mortgage Type
Reverse Mortgage Home Equity Conversion Mortgage
Create a Home Valuation Report for This Property
The Home Valuation Report is an in-depth analysis detailing your home's value as well as a comparison with similar homes in the area
Home Values in the Area
Average Home Value in this Area
Purchase History
| Date | Buyer | Sale Price | Title Company |
|---|---|---|---|
| Otuafi Samantha Lisa | -- | Meridian Title | |
| Otuafi Samantha | -- | Backman Title | |
| Ableman Ronald P | -- | American Preferred | |
| Mountain Prime Llc | -- | Founders Title Co L | |
| Byington Wendell H | -- | None Available | |
| Byington Weldon D | -- | None Available | |
| Byington Weldon D | -- | None Available | |
| Byington Erma R | -- | Utah Commercial Title |
Source: Public Records
Mortgage History
| Date | Status | Borrower | Loan Amount |
|---|---|---|---|
| Open | Otuafi Samantha Lisa | $287,952 | |
| Previous Owner | Ableman Ronald P | $5,300 | |
| Previous Owner | Ableman Ronald P | $125,729 | |
| Previous Owner | Mountain Prime Llc | $55,000 | |
| Previous Owner | Byington Erma R | $217,500 |
Source: Public Records
Tax History Compared to Growth
Tax History
| Year | Tax Paid | Tax Assessment Tax Assessment Total Assessment is a certain percentage of the fair market value that is determined by local assessors to be the total taxable value of land and additions on the property. | Land | Improvement |
|---|---|---|---|---|
| 2025 | $2,196 | $211,200 | $85,976 | $125,224 |
| 2024 | $2,145 | $207,350 | $94,491 | $112,859 |
| 2023 | $1,991 | $356,000 | $107,532 | $248,468 |
| 2022 | $2,096 | $207,350 | $65,749 | $141,601 |
| 2021 | $1,915 | $281,000 | $82,358 | $198,642 |
| 2020 | $1,645 | $239,000 | $70,005 | $168,995 |
| 2019 | $1,579 | $224,000 | $81,761 | $142,239 |
| 2018 | $1,392 | $194,000 | $69,052 | $124,948 |
| 2016 | $1,209 | $87,010 | $26,894 | $60,116 |
| 2015 | $1,123 | $76,835 | $26,894 | $49,941 |
| 2014 | $1,168 | $81,233 | $26,894 | $54,339 |
| 2013 | -- | $66,284 | $25,230 | $41,054 |
Source: Public Records
Map
Nearby Homes