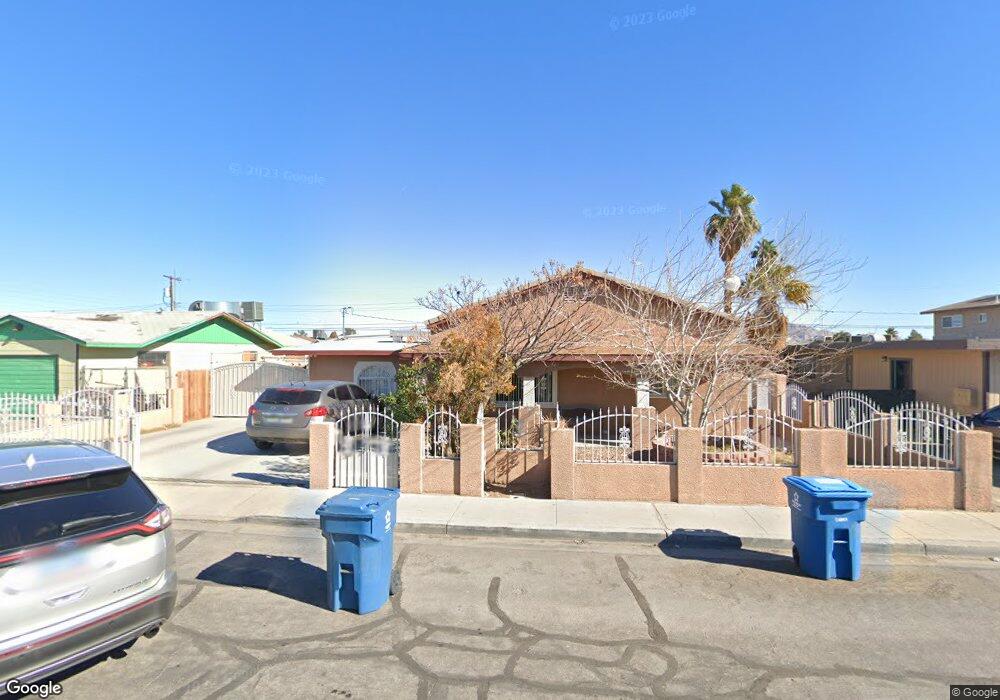
2258 Statz St North Las Vegas, NV 89030
Downtown North Las Vegas NeighborhoodEstimated Value: $335,014 - $408,000
4
Beds
2
Baths
1,846
Sq Ft
$204/Sq Ft
Est. Value
About This Home
This home is located at 2258 Statz St, North Las Vegas, NV 89030 and is currently estimated at $376,004, approximately $203 per square foot. 2258 Statz St is a home located in Clark County with nearby schools including Fay Herron Elementary School, Von Tobel Middle School, and Rancho High School.
Ownership History
Date
Name
Owned For
Owner Type
Purchase Details
Closed on
Jan 30, 2004
Sold by
Vieyra David
Bought by
Vieyra David and Gaspar Mireya
Current Estimated Value
Home Financials for this Owner
Home Financials are based on the most recent Mortgage that was taken out on this home.
Original Mortgage
$92,771
Interest Rate
5.79%
Mortgage Type
FHA
Purchase Details
Closed on
Aug 8, 2001
Sold by
Gaspar Mireya
Bought by
Vieyra David
Home Financials for this Owner
Home Financials are based on the most recent Mortgage that was taken out on this home.
Original Mortgage
$92,429
Interest Rate
7.1%
Mortgage Type
FHA
Purchase Details
Closed on
Nov 2, 2000
Sold by
George Ralph A
Bought by
Vieyra David
Home Financials for this Owner
Home Financials are based on the most recent Mortgage that was taken out on this home.
Original Mortgage
$88,344
Interest Rate
7.9%
Mortgage Type
FHA
Purchase Details
Closed on
Nov 9, 1993
Sold by
George Leslie Beth
Bought by
George Ralph A
Create a Home Valuation Report for This Property
The Home Valuation Report is an in-depth analysis detailing your home's value as well as a comparison with similar homes in the area
Home Values in the Area
Average Home Value in this Area
Purchase History
| Date | Buyer | Sale Price | Title Company |
|---|---|---|---|
| Vieyra David | -- | Lawyers Title Of Nevada | |
| Vieyra David | -- | Land Title | |
| Vieyra David | $88,500 | United Title | |
| George Ralph A | -- | -- |
Source: Public Records
Mortgage History
| Date | Status | Borrower | Loan Amount |
|---|---|---|---|
| Closed | Vieyra David | $92,771 | |
| Closed | Vieyra David | $92,429 | |
| Previous Owner | Vieyra David | $88,344 |
Source: Public Records
Tax History Compared to Growth
Tax History
| Year | Tax Paid | Tax Assessment Tax Assessment Total Assessment is a certain percentage of the fair market value that is determined by local assessors to be the total taxable value of land and additions on the property. | Land | Improvement |
|---|---|---|---|---|
| 2025 | $1,110 | $49,975 | $24,500 | $25,475 |
| 2024 | $1,078 | $49,975 | $24,500 | $25,475 |
| 2023 | $1,078 | $50,337 | $24,500 | $25,837 |
| 2022 | $1,148 | $47,079 | $22,750 | $24,329 |
| 2021 | $1,063 | $43,038 | $19,250 | $23,788 |
| 2020 | $984 | $41,711 | $17,500 | $24,211 |
| 2019 | $922 | $37,056 | $12,600 | $24,456 |
| 2018 | $880 | $34,427 | $10,500 | $23,927 |
| 2017 | $1,123 | $33,466 | $8,750 | $24,716 |
| 2016 | $825 | $33,482 | $5,250 | $28,232 |
| 2015 | $822 | $33,194 | $4,900 | $28,294 |
| 2014 | $798 | $24,314 | $4,200 | $20,114 |
Source: Public Records
Map
Nearby Homes
- 2252 Ellis St
- 0 Belmont St
- 3024 Orr Ave
- 2404 Bassler St
- 3220 Orr Ave
- 3104 Dillon Ave
- 2321 Mccarran St
- 3101 Cypress Ave
- 3104 Twining Ave
- 3402 Lillis Cir
- 2214 Daley St
- 2315 N Mccarran St
- 3215 Dillon Ave
- 2728 Haddock Ave
- 2724 Haddock Ave
- 3308 Tabor Ave
- 2537 Las Vegas Blvd N Unit 84
- 2537 Las Vegas Blvd N Unit 80A
- 2537 Las Vegas Blvd N Unit 42
- 2537 Las Vegas Blvd N Unit 59
- 2252 Statz St
- 2302 Statz St
- 2253 Belmont St
- 2308 Statz St
- 2249 Belmont St
- 2249 N Belmont St
- 2244 Statz St
- 2301 Belmont St
- 2245 Belmont St Unit 2
- 2245 Belmont St Unit 1
- 2310 Statz St
- 2305 Belmont St
- 2257 Statz St
- 2241 Belmont St
- 2253 Statz St
- 3015 Glendale Ave
- 2305 Statz St Unit 14
- 2305 Statz St
- 2240 Statz St
- 2249 Statz St