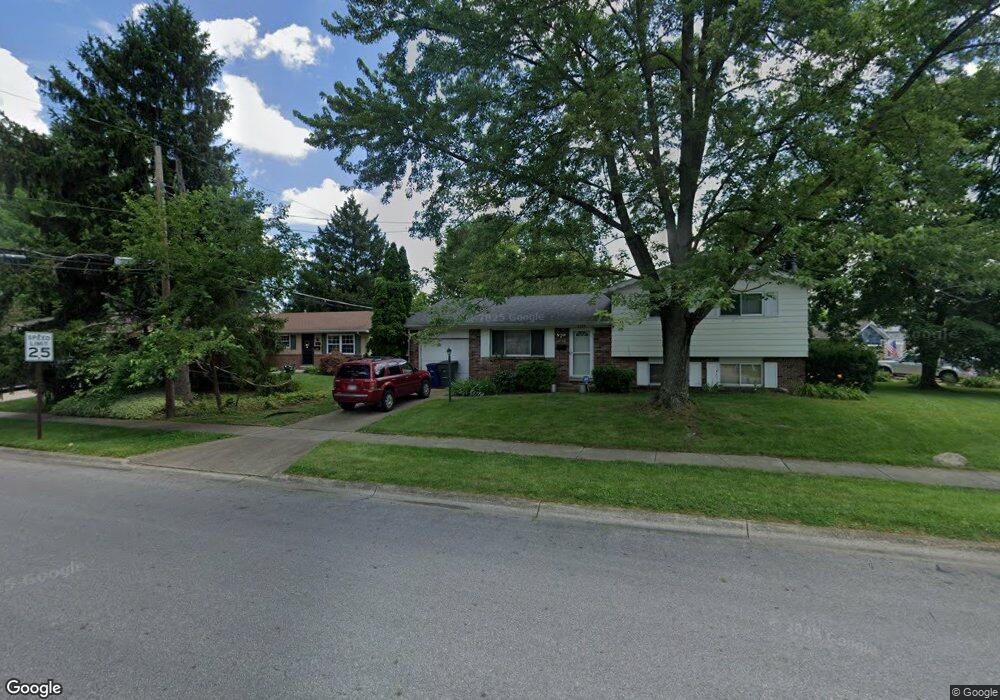
2259 Edmonton Rd Columbus, OH 43229
Forest Park East NeighborhoodEstimated Value: $284,000 - $294,000
5
Beds
3
Baths
1,798
Sq Ft
$160/Sq Ft
Est. Value
About This Home
This home is located at 2259 Edmonton Rd, Columbus, OH 43229 and is currently estimated at $287,445, approximately $159 per square foot. 2259 Edmonton Rd is a home located in Franklin County with nearby schools including Northtowne Elementary School, Woodward Park Middle School, and Northland High School.
Ownership History
Date
Name
Owned For
Owner Type
Purchase Details
Closed on
Nov 4, 2015
Sold by
Johnson Tinia M
Bought by
Johnson David E
Current Estimated Value
Purchase Details
Closed on
Jun 23, 2003
Sold by
Zbib Adnan A
Bought by
Johnson David E and Johnson Tinia M
Home Financials for this Owner
Home Financials are based on the most recent Mortgage that was taken out on this home.
Original Mortgage
$115,557
Interest Rate
5.4%
Mortgage Type
FHA
Purchase Details
Closed on
Jan 3, 1996
Sold by
Oxenrider Roy E
Bought by
Zbib Adnan A and Zbib Cynthia C
Home Financials for this Owner
Home Financials are based on the most recent Mortgage that was taken out on this home.
Original Mortgage
$85,500
Interest Rate
7.41%
Mortgage Type
New Conventional
Create a Home Valuation Report for This Property
The Home Valuation Report is an in-depth analysis detailing your home's value as well as a comparison with similar homes in the area
Home Values in the Area
Average Home Value in this Area
Purchase History
| Date | Buyer | Sale Price | Title Company |
|---|---|---|---|
| Johnson David E | $57,900 | None Available | |
| Johnson David E | $116,500 | -- | |
| Zbib Adnan A | $90,000 | -- |
Source: Public Records
Mortgage History
| Date | Status | Borrower | Loan Amount |
|---|---|---|---|
| Previous Owner | Johnson David E | $115,557 | |
| Previous Owner | Zbib Adnan A | $85,500 |
Source: Public Records
Tax History
| Year | Tax Paid | Tax Assessment Tax Assessment Total Assessment is a certain percentage of the fair market value that is determined by local assessors to be the total taxable value of land and additions on the property. | Land | Improvement |
|---|---|---|---|---|
| 2025 | $3,542 | $78,930 | $23,980 | $54,950 |
| 2024 | $3,542 | $78,930 | $23,980 | $54,950 |
| 2023 | $3,497 | $78,930 | $23,980 | $54,950 |
| 2022 | $2,681 | $51,700 | $16,450 | $35,250 |
| 2021 | $2,686 | $51,700 | $16,450 | $35,250 |
| 2020 | $2,690 | $51,700 | $16,450 | $35,250 |
| 2019 | $2,459 | $40,530 | $13,160 | $27,370 |
| 2018 | $2,362 | $40,530 | $13,160 | $27,370 |
| 2017 | $2,457 | $40,530 | $13,160 | $27,370 |
| 2016 | $2,500 | $37,740 | $9,280 | $28,460 |
| 2015 | $2,269 | $37,740 | $9,280 | $28,460 |
| 2014 | $2,275 | $37,740 | $9,280 | $28,460 |
| 2013 | $1,181 | $39,725 | $9,765 | $29,960 |
Source: Public Records
Map
Nearby Homes
- 4885 Northtowne Blvd
- 2251 Tuliptree Ave
- 4735 Heatherton Dr
- 0 Chester Rd
- 1905 Denise Dr
- 0 Abington Rd Unit 225045775
- 0 Abington Rd Unit 224031704
- 0 Abington Rd Unit 224031738
- 0 Abington Rd Unit 224031699
- 0 Abington Rd Unit 225045777
- 2618 Clybourne Rd
- 4979 Lyle Rd
- 2601 Brooklyn Rd
- 2594 Adda Ave
- 4857 Tamarack Blvd
- 2903 Kilbourne Ave
- 2294 Teakwood Dr
- 4852 Snowbird Cir Unit 13B
- 2669 Alder Vista Dr
- 4660 Glenhaven Dr
- 2263 Edmonton Rd
- 4850 Northtowne Blvd
- 2267 Edmonton Rd
- 4842 Northtowne Blvd
- 4859 Northtowne Blvd
- 4842 Northtown
- 2258 Edmonton Rd
- 2264 Edmonton Rd
- 4855 Manitoba Rd
- 4861 Manitoba Rd
- 2271 Edmonton Rd
- 4843 Manitoba Rd
- 4835 Northtowne Blvd
- 4863 Northtowne Blvd
- 4834 Northtowne Blvd
- 4869 Manitoba Rd
- 4864 Northtowne Blvd
- 2247 Waldorf Rd
- 4835 Manitoba Rd
- 2246 Trent Rd
Your Personal Tour Guide
Ask me questions while you tour the home.