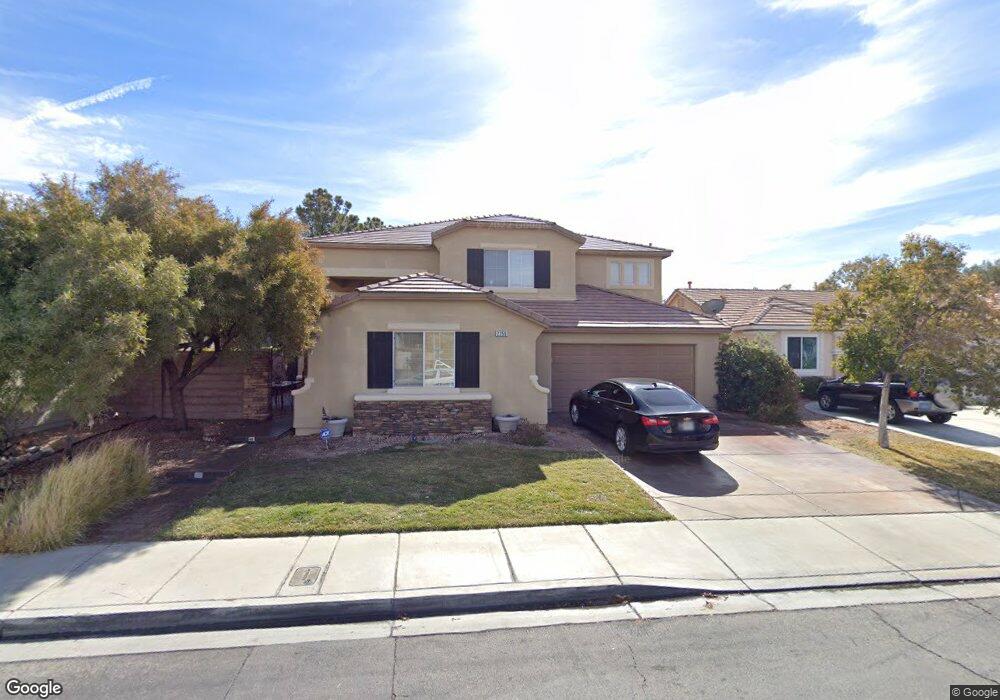
2259 Lyrical Rd Unit 4 Henderson, NV 89052
Anthem Country Club NeighborhoodEstimated Value: $759,209 - $800,000
4
Beds
3
Baths
2,736
Sq Ft
$286/Sq Ft
Est. Value
About This Home
This home is located at 2259 Lyrical Rd Unit 4, Henderson, NV 89052 and is currently estimated at $781,552, approximately $285 per square foot. 2259 Lyrical Rd Unit 4 is a home located in Clark County with nearby schools including Frank S Lamping Elementary School, Del E. Webb Middle School, and Coronado High School.
Ownership History
Date
Name
Owned For
Owner Type
Purchase Details
Closed on
Oct 5, 2001
Sold by
Wrocklage Robert A and Wrocklage Debbie L
Bought by
Ballweg John C and Ballweg Elizabeth L
Current Estimated Value
Home Financials for this Owner
Home Financials are based on the most recent Mortgage that was taken out on this home.
Original Mortgage
$296,500
Outstanding Balance
$115,637
Interest Rate
6.84%
Estimated Equity
$665,915
Purchase Details
Closed on
Jun 6, 2000
Sold by
Del Webbs Coventry Homes Of Nevada Inc
Bought by
Wrocklage Robert A and Wrocklage Debbie L
Home Financials for this Owner
Home Financials are based on the most recent Mortgage that was taken out on this home.
Original Mortgage
$240,668
Interest Rate
8.55%
Create a Home Valuation Report for This Property
The Home Valuation Report is an in-depth analysis detailing your home's value as well as a comparison with similar homes in the area
Home Values in the Area
Average Home Value in this Area
Purchase History
| Date | Buyer | Sale Price | Title Company |
|---|---|---|---|
| Ballweg John C | $320,000 | Fidelity National Title | |
| Wrocklage Robert A | $230,225 | Del Webb Title Company Nevad |
Source: Public Records
Mortgage History
| Date | Status | Borrower | Loan Amount |
|---|---|---|---|
| Open | Ballweg John C | $296,500 | |
| Previous Owner | Wrocklage Robert A | $240,668 |
Source: Public Records
Tax History Compared to Growth
Tax History
| Year | Tax Paid | Tax Assessment Tax Assessment Total Assessment is a certain percentage of the fair market value that is determined by local assessors to be the total taxable value of land and additions on the property. | Land | Improvement |
|---|---|---|---|---|
| 2025 | $3,860 | $178,417 | $57,750 | $120,667 |
| 2024 | $3,748 | $178,417 | $57,750 | $120,667 |
| 2023 | $2,869 | $165,622 | $51,800 | $113,822 |
| 2022 | $3,990 | $148,776 | $44,450 | $104,326 |
| 2021 | $3,695 | $140,022 | $40,950 | $99,072 |
| 2020 | $3,428 | $139,004 | $40,950 | $98,054 |
| 2019 | $3,212 | $133,765 | $37,100 | $96,665 |
| 2018 | $3,065 | $124,908 | $31,850 | $93,058 |
| 2017 | $3,666 | $126,462 | $31,850 | $94,612 |
| 2016 | $2,869 | $108,354 | $14,000 | $94,354 |
| 2015 | $2,863 | $106,510 | $14,000 | $92,510 |
| 2014 | $2,780 | $93,107 | $12,250 | $80,857 |
Source: Public Records
Map
Nearby Homes
- 2288 Tedesca Dr Unit 4
- 2251 Tedesca Dr
- 2285 Moresca Ave
- 2200 Tedesca Dr
- 9 Contra Costa Place
- 3 Isleworth Dr
- 17 Contra Costa Place
- 9 Ibis Ct
- 29 Desert Highlands Dr
- 2150 Ponticello Dr
- 2378 Falsetto Ave
- 2383 Rainswept Ave
- 2 El Macero Ct
- 71 Fountainhead Cir
- 2197 Big Bar Dr
- 67 Fountainhead Cir
- 77 Fountainhead Cir
- 2280 Bull Lake Dr
- 31 Isleworth Dr
- 2420 Taragato Ave
- 2257 Lyrical Rd
- 2261 Lyrical Rd Unit 4
- 2255 Lyrical Rd
- 2258 Galindo Ct
- 2256 Galindo Ct
- 2260 Galindo Ct
- 2254 Galindo Ct
- 2260 Lyrical Rd
- 2256 Lyrical Rd Unit 4
- 2253 Lyrical Rd
- 2254 Lyrical Rd
- 1371 Temporale Dr
- 1373 Temporale Dr
- 1375 Temporale Dr
- 2252 Galindo Ct
- 2264 Lyrical Rd
- 2251 Lyrical Rd
- 1377 Temporale Dr
- 1362 Temporale Dr
- 2250 Lyrical Rd Unit 4