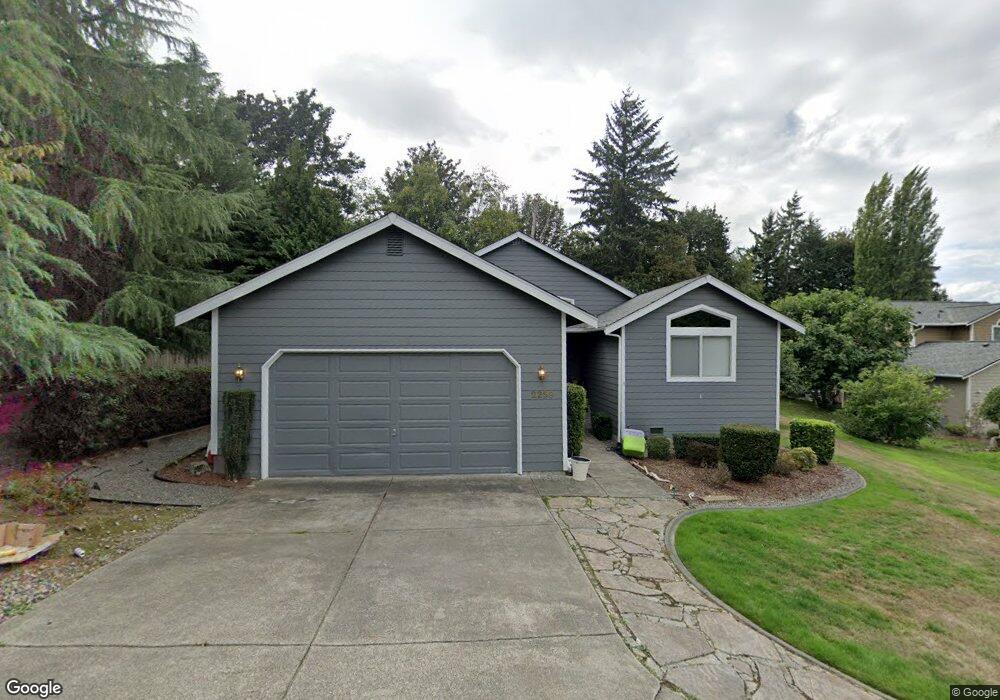
2259 Steamboat Loop E Port Orchard, WA 98366
Parkwood NeighborhoodEstimated Value: $506,217 - $562,000
3
Beds
2
Baths
1,461
Sq Ft
$360/Sq Ft
Est. Value
About This Home
This home is located at 2259 Steamboat Loop E, Port Orchard, WA 98366 and is currently estimated at $526,054, approximately $360 per square foot. 2259 Steamboat Loop E is a home located in Kitsap County with nearby schools including Orchard Heights Elementary School, Marcus Whitman Middle School, and South Kitsap High School.
Ownership History
Date
Name
Owned For
Owner Type
Purchase Details
Closed on
Sep 9, 2003
Sold by
Hughes Glenda M
Bought by
Simetz Alan K and Hughes Glenda M
Current Estimated Value
Home Financials for this Owner
Home Financials are based on the most recent Mortgage that was taken out on this home.
Original Mortgage
$155,595
Interest Rate
6.06%
Mortgage Type
VA
Purchase Details
Closed on
Sep 17, 2001
Sold by
Points West Inc
Bought by
Hughes Glenda M
Home Financials for this Owner
Home Financials are based on the most recent Mortgage that was taken out on this home.
Original Mortgage
$152,949
Interest Rate
7%
Mortgage Type
VA
Purchase Details
Closed on
Apr 27, 2001
Sold by
First Community Bank Of Washington
Bought by
Points West Inc and American Dream Homes
Home Financials for this Owner
Home Financials are based on the most recent Mortgage that was taken out on this home.
Original Mortgage
$112,000
Interest Rate
6.98%
Create a Home Valuation Report for This Property
The Home Valuation Report is an in-depth analysis detailing your home's value as well as a comparison with similar homes in the area
Home Values in the Area
Average Home Value in this Area
Purchase History
| Date | Buyer | Sale Price | Title Company |
|---|---|---|---|
| Simetz Alan K | -- | Transnation Title Ins Co | |
| Hughes Glenda M | $149,950 | Transnation Title Insurance | |
| Points West Inc | $25,000 | Transnation Title Insurance |
Source: Public Records
Mortgage History
| Date | Status | Borrower | Loan Amount |
|---|---|---|---|
| Closed | Simetz Alan K | $155,595 | |
| Closed | Hughes Glenda M | $152,949 | |
| Previous Owner | Points West Inc | $112,000 |
Source: Public Records
Tax History Compared to Growth
Tax History
| Year | Tax Paid | Tax Assessment Tax Assessment Total Assessment is a certain percentage of the fair market value that is determined by local assessors to be the total taxable value of land and additions on the property. | Land | Improvement |
|---|---|---|---|---|
| 2026 | $3,741 | $464,830 | $105,690 | $359,140 |
| 2025 | $3,741 | $424,550 | $88,730 | $335,820 |
| 2024 | $3,628 | $424,550 | $88,730 | $335,820 |
| 2023 | $3,604 | $424,550 | $88,730 | $335,820 |
| 2022 | $3,563 | $351,820 | $82,860 | $268,960 |
| 2021 | $3,452 | $322,640 | $77,000 | $245,640 |
| 2020 | $3,392 | $308,090 | $73,330 | $234,760 |
| 2019 | $2,923 | $291,070 | $71,270 | $219,800 |
| 2018 | $3,081 | $239,280 | $71,270 | $168,010 |
| 2017 | $2,648 | $239,280 | $71,270 | $168,010 |
| 2016 | $2,604 | $215,280 | $71,270 | $144,010 |
| 2015 | $2,524 | $211,490 | $71,270 | $140,220 |
| 2014 | -- | $207,700 | $71,270 | $136,430 |
| 2013 | -- | $203,920 | $75,010 | $128,910 |
Source: Public Records
Map
Nearby Homes
- 1341 Salt Point Place E
- 3140 E Washington St
- 3817 SE Horstman Rd
- 0 E Washington St Unit NWM2337936
- 4233 SE Horsehead Way
- 22 Lots E Washington St
- 0 Beach Dr E Unit NWM2448019
- 0 Beach Dr E Unit NWM2139946
- 0 Wendell Ave SE
- 4798 E Stable Ln
- 4010 SE Lovell St
- 4305 SE Elijah Ct
- 1200 Baby Doll Rd E
- 123 E 4th St
- 3900 SE Mile Hill Dr
- 3930 SE Mile Hill Dr
- 1663 Harrison Ave SE
- 1703 Harrison Ave SE
- 2949 SE Mile Hill Dr Unit C-2
- 4990 Mile Hill Dr
- 2259 Steamboat Loop E
- 2265 Steamboat Loop E
- 2247 Steamboat Loop E
- 2253 Steamboat Loop E
- 2283 Steamboat E Lot#18 Loop
- 2300 Steamboat Loop E
- 2300 Steamboat Loop E
- 2306 Steamboat Loop E
- 2294 Steamboat Loop E
- 2241 Steamboat Loop E
- 2325 Steamboat Loop E
- 2283 Steamboat Loop E
- 2288 Steamboat Loop E
- 2312 Steamboat Loop E
- 2285 Steamboat Loop E
- 2289 Steamboat Loop E
- 2277 Steamboat Loop E
- 2289 Steamboat Loop E
- 2235 Steamboat Loop E
- 2295 Steamboat Loop E