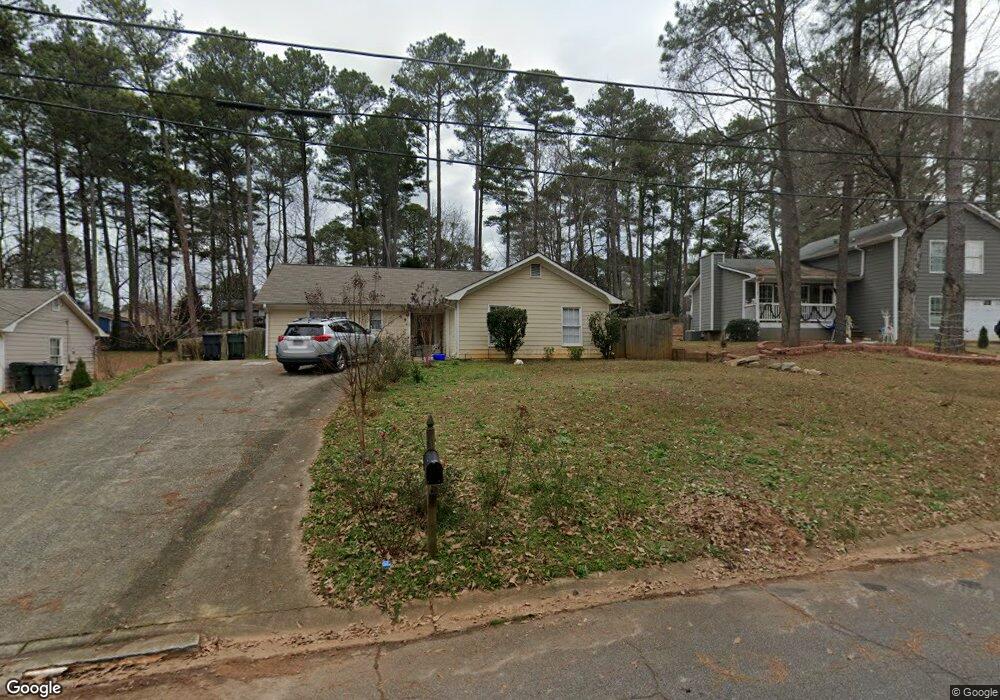
2259 Summertown Dr Norcross, GA 30071
Estimated Value: $313,565 - $350,000
4
Beds
2
Baths
1,268
Sq Ft
$262/Sq Ft
Est. Value
About This Home
This home is located at 2259 Summertown Dr, Norcross, GA 30071 and is currently estimated at $331,641, approximately $261 per square foot. 2259 Summertown Dr is a home located in Gwinnett County with nearby schools including Baldwin Elementary, Summerour Middle School, and Paul Duke STEM High School.
Ownership History
Date
Name
Owned For
Owner Type
Purchase Details
Closed on
Oct 8, 2024
Sold by
Nguyen Nga Thuy
Bought by
Nguyen Bradley
Current Estimated Value
Purchase Details
Closed on
Dec 19, 2008
Sold by
Federal Natl Mtg Assn Fnma
Bought by
Nguyen Nga T
Home Financials for this Owner
Home Financials are based on the most recent Mortgage that was taken out on this home.
Original Mortgage
$30,000
Interest Rate
5.96%
Mortgage Type
New Conventional
Purchase Details
Closed on
Feb 5, 2008
Sold by
Everhome Mortgage
Bought by
Federal National Mortgage Association
Purchase Details
Closed on
Apr 25, 2005
Sold by
Trejo Gaspar R
Bought by
Merino Milton R
Home Financials for this Owner
Home Financials are based on the most recent Mortgage that was taken out on this home.
Original Mortgage
$130,000
Interest Rate
5.99%
Mortgage Type
New Conventional
Purchase Details
Closed on
May 25, 1999
Sold by
Grier Craig R
Bought by
Trejo Gaspar R
Create a Home Valuation Report for This Property
The Home Valuation Report is an in-depth analysis detailing your home's value as well as a comparison with similar homes in the area
Home Values in the Area
Average Home Value in this Area
Purchase History
| Date | Buyer | Sale Price | Title Company |
|---|---|---|---|
| Nguyen Bradley | -- | -- | |
| Nguyen Nga T | -- | -- | |
| Federal National Mortgage Association | -- | -- | |
| Everhorme Mortgage Co | $114,263 | -- | |
| Merino Milton R | $130,000 | -- | |
| Trejo Gaspar R | $104,900 | -- |
Source: Public Records
Mortgage History
| Date | Status | Borrower | Loan Amount |
|---|---|---|---|
| Previous Owner | Nguyen Nga T | $30,000 | |
| Previous Owner | Merino Milton R | $130,000 |
Source: Public Records
Tax History Compared to Growth
Tax History
| Year | Tax Paid | Tax Assessment Tax Assessment Total Assessment is a certain percentage of the fair market value that is determined by local assessors to be the total taxable value of land and additions on the property. | Land | Improvement |
|---|---|---|---|---|
| 2025 | $3,281 | $117,360 | $25,840 | $91,520 |
| 2024 | $2,251 | $102,800 | $22,400 | $80,400 |
| 2023 | $2,251 | $102,800 | $22,400 | $80,400 |
| 2022 | $2,028 | $91,560 | $22,400 | $69,160 |
| 2021 | $1,552 | $60,280 | $13,600 | $46,680 |
| 2020 | $580 | $60,280 | $13,600 | $46,680 |
| 2019 | $1,766 | $46,920 | $10,800 | $36,120 |
| 2018 | $1,283 | $46,920 | $10,800 | $36,120 |
| 2016 | $1,027 | $36,680 | $8,000 | $28,680 |
| 2015 | $1,069 | $28,160 | $6,000 | $22,160 |
| 2014 | $758 | $28,160 | $6,000 | $22,160 |
Source: Public Records
Map
Nearby Homes
- 2199 Summertown Dr
- 5477 Windy Creek Ln
- 5479 Windy Creek Ln
- 2375 Beaver Falls Dr
- 5364 Hickory Knoll
- 5358 Beaver Branch
- 5357 Beaver Branch
- 26 Reeves St
- 5341 Goodwick Way
- 5457 Rails Way
- 5639 Chatham Cir
- 5381 Station Cir Unit 3
- 2340 Beaver Ruin Rd Unit 26
- 2340 Beaver Ruin Rd Unit 41
- 2340 Beaver Ruin Rd
- 2340 Beaver Ruin Rd Unit 15
- 2340 Beaver Ruin Rd Unit 16
- 5645 Hammond Dr
- 2848 Wild Laurel Ct
- 2472 Westhill Ct NW
- 2269 Summertown Dr Unit 3
- 2249 Summertown Dr Unit 3
- 2279 Summertown Dr
- 5474 Doncaster Ct Unit 1
- 5506 Westberry Ln
- 2239 Summertown Dr Unit 3
- 2289 Summertown Dr Unit 3
- 5494 Doncaster Ct
- 2238 Summertown Dr
- 2262 New Castle Cir Unit 1
- 2278 Summertown Dr
- 2278 Summertown Dr
- 5464 Doncaster Ct
- 2272 New Castle Cir
- 2229 Summertown Dr
- 2299 Summertown Dr
- 2252 New Castle Cir Unit 1
- 5504 Doncaster Ct Unit I
- 2218 Summertown Dr
- 2242 New Castle Cir