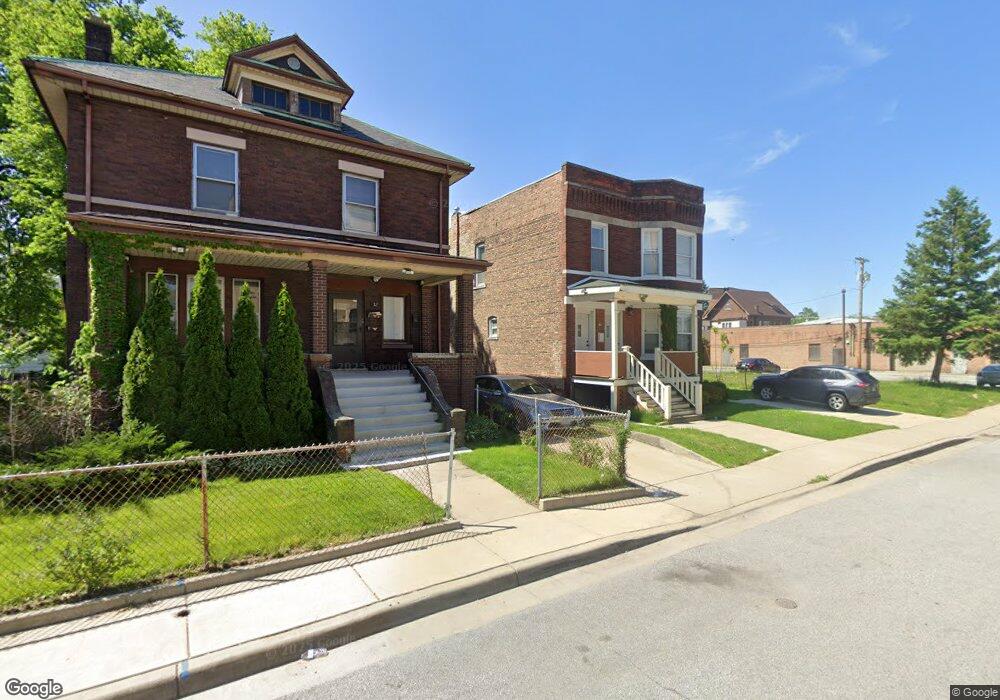
226-28 Carroll St Hammond, IN 46320
Estimated Value: $133,000 - $228,000
4
Beds
4
Baths
2,640
Sq Ft
$76/Sq Ft
Est. Value
About This Home
This home is located at 226-28 Carroll St, Hammond, IN 46320 and is currently estimated at $200,888, approximately $76 per square foot. 226-28 Carroll St is a home located in Lake County with nearby schools including Lew Wallace Elementary School, Eggers Middle School, and Hammond High School.
Ownership History
Date
Name
Owned For
Owner Type
Purchase Details
Closed on
Dec 14, 2011
Sold by
Fannie Mae
Bought by
Reyes Juan
Current Estimated Value
Purchase Details
Closed on
Jan 26, 2010
Sold by
Wells Fargo Bank Na
Bought by
Federal National Mortgage Association
Purchase Details
Closed on
Jan 8, 2010
Sold by
Miller Wesley E
Bought by
Wells Fargo Bank Na and Americas Servicing Company
Purchase Details
Closed on
Jan 2, 2009
Sold by
Miller Anita B
Bought by
Miller Wesley E
Create a Home Valuation Report for This Property
The Home Valuation Report is an in-depth analysis detailing your home's value as well as a comparison with similar homes in the area
Home Values in the Area
Average Home Value in this Area
Purchase History
| Date | Buyer | Sale Price | Title Company |
|---|---|---|---|
| Reyes Juan | -- | Meridian Title Corp | |
| Federal National Mortgage Association | -- | None Available | |
| Wells Fargo Bank Na | $150,481 | None Available | |
| Miller Wesley E | -- | None Available |
Source: Public Records
Tax History Compared to Growth
Tax History
| Year | Tax Paid | Tax Assessment Tax Assessment Total Assessment is a certain percentage of the fair market value that is determined by local assessors to be the total taxable value of land and additions on the property. | Land | Improvement |
|---|---|---|---|---|
| 2024 | $7,007 | $181,900 | $21,400 | $160,500 |
| 2023 | $3,725 | $146,600 | $22,000 | $124,600 |
| 2022 | $3,725 | $139,000 | $22,000 | $117,000 |
| 2021 | $3,079 | $113,600 | $11,000 | $102,600 |
| 2020 | $2,926 | $107,200 | $11,000 | $96,200 |
| 2019 | $2,878 | $100,700 | $12,900 | $87,800 |
| 2018 | $2,499 | $79,600 | $12,900 | $66,700 |
| 2017 | $4,050 | $113,400 | $19,800 | $93,600 |
| 2016 | $3,297 | $106,900 | $19,800 | $87,100 |
| 2014 | $3,678 | $117,400 | $19,800 | $97,600 |
| 2013 | $3,250 | $109,600 | $19,800 | $89,800 |
Source: Public Records
Map
Nearby Homes