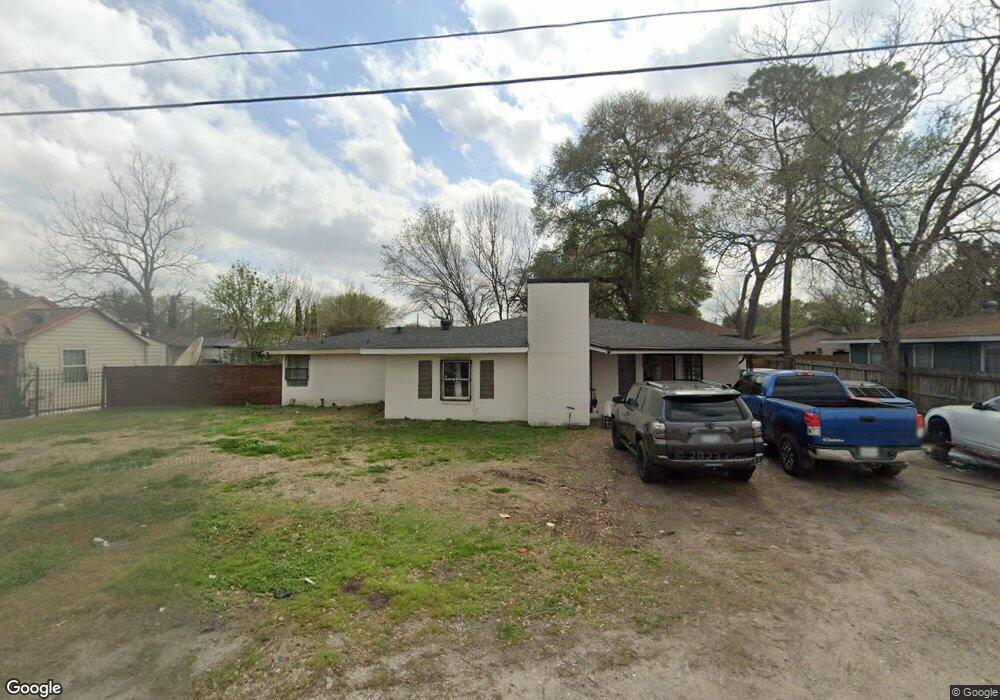
226 Burress St Houston, TX 77022
Northside-Northline NeighborhoodEstimated Value: $246,333 - $366,000
3
Beds
2
Baths
1,862
Sq Ft
$153/Sq Ft
Est. Value
About This Home
This home is located at 226 Burress St, Houston, TX 77022 and is currently estimated at $284,333, approximately $152 per square foot. 226 Burress St is a home located in Harris County with nearby schools including Burbank Elementary School, Burbank Middle School, and Sam Houston Math, Science & Technology Center.
Ownership History
Date
Name
Owned For
Owner Type
Purchase Details
Closed on
Jun 21, 2002
Sold by
Hernandez Ziola
Bought by
Chacon Francisco and Chacon Ana A
Current Estimated Value
Home Financials for this Owner
Home Financials are based on the most recent Mortgage that was taken out on this home.
Original Mortgage
$69,400
Outstanding Balance
$29,510
Interest Rate
6.89%
Estimated Equity
$254,823
Create a Home Valuation Report for This Property
The Home Valuation Report is an in-depth analysis detailing your home's value as well as a comparison with similar homes in the area
Home Values in the Area
Average Home Value in this Area
Purchase History
| Date | Buyer | Sale Price | Title Company |
|---|---|---|---|
| Chacon Francisco | -- | North American Title Co |
Source: Public Records
Mortgage History
| Date | Status | Borrower | Loan Amount |
|---|---|---|---|
| Open | Chacon Francisco | $69,400 |
Source: Public Records
Tax History Compared to Growth
Tax History
| Year | Tax Paid | Tax Assessment Tax Assessment Total Assessment is a certain percentage of the fair market value that is determined by local assessors to be the total taxable value of land and additions on the property. | Land | Improvement |
|---|---|---|---|---|
| 2025 | $2,183 | $190,843 | $76,000 | $114,843 |
| 2024 | $2,183 | $182,543 | $69,750 | $112,793 |
| 2023 | $2,183 | $218,087 | $42,500 | $175,587 |
| 2022 | $3,312 | $180,377 | $42,500 | $137,877 |
| 2021 | $3,187 | $143,438 | $42,500 | $100,938 |
| 2020 | $3,010 | $130,927 | $42,500 | $88,427 |
| 2019 | $2,860 | $128,520 | $35,000 | $93,520 |
| 2018 | $1,788 | $102,736 | $29,250 | $73,486 |
| 2017 | $2,537 | $102,736 | $29,250 | $73,486 |
| 2016 | $2,306 | $91,210 | $27,500 | $63,710 |
| 2015 | $1,606 | $86,386 | $20,000 | $66,386 |
| 2014 | $1,606 | $86,386 | $20,000 | $66,386 |
Source: Public Records
Map
Nearby Homes
- 216 Burress St
- 253 De Boll St
- 249 De Boll St
- 318 Charlock St
- 108 Fichter St
- 132 Grothe Ln
- 9026 Mcgallion Rd
- 411 Berry Rd
- 90 Burress St Unit B
- 90 Burress St Unit A
- 88 Berry Rd
- 61 Trenwood Ln
- 702 Pennington St
- 70 Burress St
- 202 Burbank St
- 807 Firnat St
- 56 Wellford St
- 723 Doverside St
- 8205 Appleton St
- 44 Farrell St