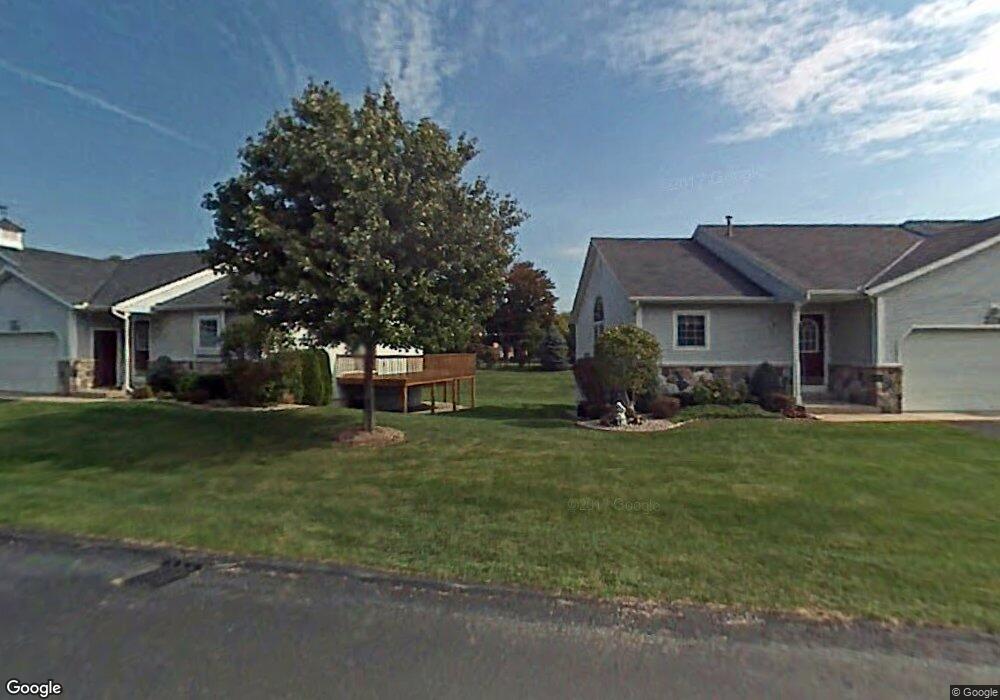
226 Carrington Place Unit 17 Holland, MI 49423
Holland Heights NeighborhoodEstimated Value: $261,000 - $324,624
2
Beds
3
Baths
1,868
Sq Ft
$159/Sq Ft
Est. Value
About This Home
This home is located at 226 Carrington Place Unit 17, Holland, MI 49423 and is currently estimated at $296,656, approximately $158 per square foot. 226 Carrington Place Unit 17 is a home located in Ottawa County with nearby schools including Holland Heights Elementary, Holland High School, and Black River Public School Elementary.
Ownership History
Date
Name
Owned For
Owner Type
Purchase Details
Closed on
Jan 18, 2022
Sold by
Revocable Living Trust
Bought by
Conger Darius J and Conger Vivian B
Current Estimated Value
Home Financials for this Owner
Home Financials are based on the most recent Mortgage that was taken out on this home.
Original Mortgage
$193,600
Outstanding Balance
$178,427
Interest Rate
3.11%
Mortgage Type
New Conventional
Estimated Equity
$118,229
Purchase Details
Closed on
Oct 14, 2021
Sold by
Ruth Vander Bie
Bought by
Vander Bie Ruth
Purchase Details
Closed on
Oct 14, 2014
Sold by
Bie Ruth Vander
Bought by
Ble Ruth Vander and Ble Revocable Living Trust
Purchase Details
Closed on
Nov 11, 1999
Sold by
Vander Bie Ruth Trust
Bought by
Vanderbie Anthony J
Purchase Details
Closed on
Oct 26, 1998
Sold by
Vander Bie Anthony J
Bought by
Vander Bie Ruth Trust
Purchase Details
Closed on
Oct 3, 1996
Sold by
Carrington Place Ltd
Bought by
Vander Bie Anthony
Create a Home Valuation Report for This Property
The Home Valuation Report is an in-depth analysis detailing your home's value as well as a comparison with similar homes in the area
Home Values in the Area
Average Home Value in this Area
Purchase History
| Date | Buyer | Sale Price | Title Company |
|---|---|---|---|
| Conger Darius J | $242,000 | Chicago Title | |
| Vander Bie Ruth | -- | Central Park Law Pplc | |
| Ble Ruth Vander | -- | None Available | |
| Vanderbie Anthony J | -- | -- | |
| Vander Bie Ruth Trust | -- | -- | |
| Vander Bie Anthony | -- | -- |
Source: Public Records
Mortgage History
| Date | Status | Borrower | Loan Amount |
|---|---|---|---|
| Open | Conger Darius J | $193,600 |
Source: Public Records
Tax History Compared to Growth
Tax History
| Year | Tax Paid | Tax Assessment Tax Assessment Total Assessment is a certain percentage of the fair market value that is determined by local assessors to be the total taxable value of land and additions on the property. | Land | Improvement |
|---|---|---|---|---|
| 2025 | $5,043 | $150,600 | $0 | $0 |
| 2024 | $4,865 | $118,800 | $0 | $0 |
| 2023 | $9,113 | $113,900 | $0 | $0 |
| 2022 | $2,437 | $80,700 | $0 | $0 |
| 2021 | $2,369 | $78,900 | $0 | $0 |
| 2020 | $2,365 | $78,400 | $0 | $0 |
| 2019 | $2,385 | $68,300 | $0 | $0 |
| 2018 | $2,245 | $67,000 | $0 | $0 |
| 2017 | $2,175 | $67,000 | $0 | $0 |
| 2016 | $2,175 | $62,200 | $0 | $0 |
| 2015 | $2,107 | $54,800 | $0 | $0 |
| 2014 | $2,107 | $51,900 | $0 | $0 |
Source: Public Records
Map
Nearby Homes
- 239 S Waverly Rd
- 289 S Waverly Rd
- 300 Farington Blvd Unit 31
- 891 Harvard Dr
- 1016 E 12th St
- 499 E 8th St
- 403 Stratford Way
- 205 Jennifer Ln
- 270 Brook Lane Ave
- VL 120th Ave
- 561 Century Ln
- 551 Century Ln
- 541 Century Ln
- 866 E 24th St Unit Parcel A
- 1214 Euna Vista Dr
- 621 Heritage Ct
- 286 E 19th St
- 955 Kenwood Dr
- 1380 E Point Ridge
- 0 E 14th St
- 226 Carrington Place
- 226 Carrington Place
- 228 Carrington Place
- 224 Carrington Place
- 234 Carrington Place
- 234 Carrington Place Unit 19
- 222 Carrington Place
- 231 Carrington Place
- 223 Carrington Place
- 229 Ferris Ave
- 229 Carrington Place
- 236 Carrington Place
- 771 E 10th St
- 235 Carrington Place Unit 11
- 219 Ferris Ave
- 221 Carrington Place
- 221 Carrington Place Unit 7
- 237 Carrington Place
- 216 Carrington Place Unit 14
- 214 Carrington Place