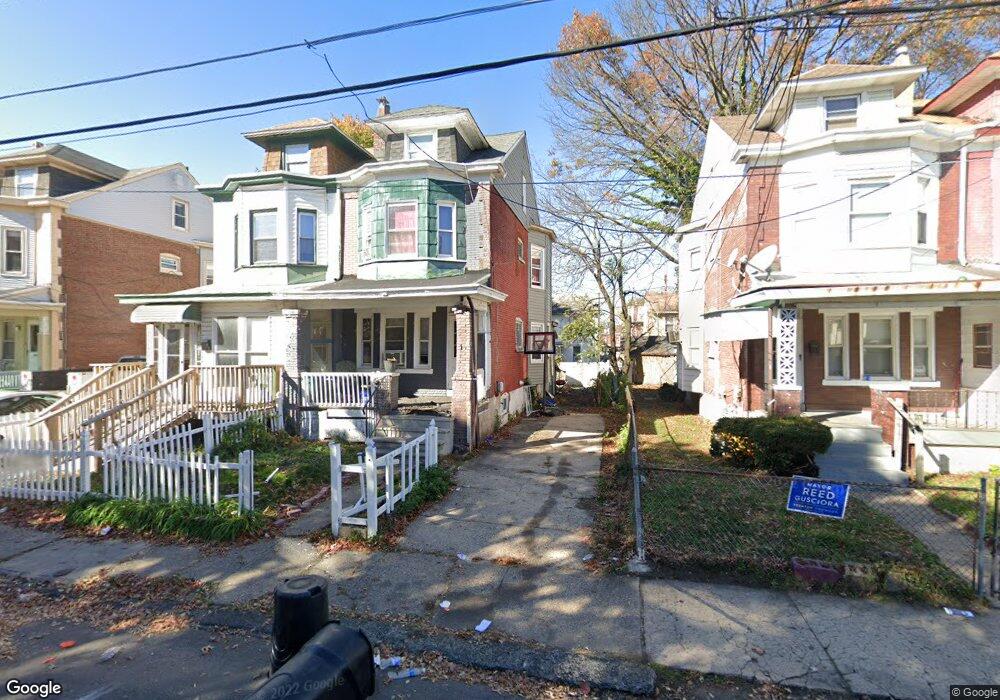
226 Euclid Ave Trenton, NJ 08609
Wilbur NeighborhoodEstimated Value: $157,000 - $195,000
--
Bed
--
Bath
1,280
Sq Ft
$141/Sq Ft
Est. Value
About This Home
This home is located at 226 Euclid Ave, Trenton, NJ 08609 and is currently estimated at $180,333, approximately $140 per square foot. 226 Euclid Ave is a home located in Mercer County with nearby schools including P.J. Hill Elementary School, Grant Elementary School, and Dr. Martin Luther King Middle School.
Ownership History
Date
Name
Owned For
Owner Type
Purchase Details
Closed on
Mar 18, 2021
Sold by
Pcireo 1 Llc
Bought by
Aponte Jose
Current Estimated Value
Purchase Details
Closed on
Jun 16, 2016
Sold by
American Trading Co and Lampley Joseph Lampley
Bought by
Pcireo 1
Home Financials for this Owner
Home Financials are based on the most recent Mortgage that was taken out on this home.
Interest Rate
3.54%
Create a Home Valuation Report for This Property
The Home Valuation Report is an in-depth analysis detailing your home's value as well as a comparison with similar homes in the area
Home Values in the Area
Average Home Value in this Area
Purchase History
| Date | Buyer | Sale Price | Title Company |
|---|---|---|---|
| Aponte Jose | $42,000 | None Available | |
| Pcireo 1 | -- | -- |
Source: Public Records
Mortgage History
| Date | Status | Borrower | Loan Amount |
|---|---|---|---|
| Previous Owner | Pcireo 1 | -- |
Source: Public Records
Tax History Compared to Growth
Tax History
| Year | Tax Paid | Tax Assessment Tax Assessment Total Assessment is a certain percentage of the fair market value that is determined by local assessors to be the total taxable value of land and additions on the property. | Land | Improvement |
|---|---|---|---|---|
| 2025 | $2,013 | $34,700 | $5,900 | $28,800 |
| 2024 | $1,932 | $34,700 | $5,900 | $28,800 |
| 2023 | $1,932 | $34,700 | $5,900 | $28,800 |
| 2022 | $1,894 | $34,700 | $5,900 | $28,800 |
| 2021 | $1,927 | $34,700 | $5,900 | $28,800 |
| 2020 | $1,921 | $34,700 | $5,900 | $28,800 |
| 2019 | $1,890 | $34,700 | $5,900 | $28,800 |
| 2018 | $1,809 | $34,700 | $5,900 | $28,800 |
| 2017 | $1,719 | $34,700 | $5,900 | $28,800 |
| 2016 | $3,613 | $62,800 | $9,600 | $53,200 |
| 2015 | $3,600 | $62,800 | $9,600 | $53,200 |
| 2014 | $3,583 | $62,800 | $9,600 | $53,200 |
Source: Public Records
Map
Nearby Homes