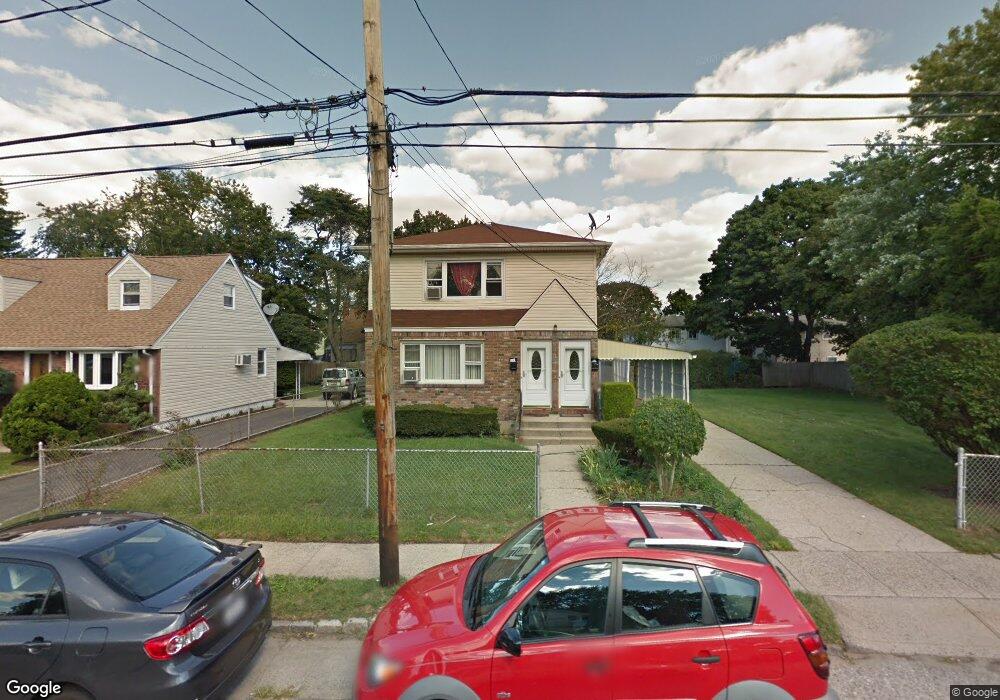
226 Hopper St Westbury, NY 11590
Estimated Value: $813,729 - $875,000
6
Beds
3
Baths
2,075
Sq Ft
$407/Sq Ft
Est. Value
About This Home
This home is located at 226 Hopper St, Westbury, NY 11590 and is currently estimated at $844,365, approximately $406 per square foot. 226 Hopper St is a home located in Nassau County with nearby schools including Westbury Middle School, Westbury High School, and Westbury Friends School.
Ownership History
Date
Name
Owned For
Owner Type
Purchase Details
Closed on
May 10, 2021
Sold by
Swaby Pressley and Swaby Beverly
Bought by
Singh Jagpreet and Kaur Sonampreet
Current Estimated Value
Home Financials for this Owner
Home Financials are based on the most recent Mortgage that was taken out on this home.
Original Mortgage
$465,000
Outstanding Balance
$421,406
Interest Rate
3.1%
Mortgage Type
New Conventional
Estimated Equity
$422,959
Purchase Details
Closed on
Oct 19, 1999
Sold by
Dawkins Adam H and Dawkins Hortense
Bought by
Swaby Pressley and Swaby Beverly
Home Financials for this Owner
Home Financials are based on the most recent Mortgage that was taken out on this home.
Original Mortgage
$173,569
Interest Rate
7.73%
Mortgage Type
FHA
Purchase Details
Closed on
Jun 1, 1999
Purchase Details
Closed on
May 26, 1999
Sold by
Dawkins Adam H and Dawkins Hortense
Bought by
Dawkins Adam H and Dawkins Hortense
Create a Home Valuation Report for This Property
The Home Valuation Report is an in-depth analysis detailing your home's value as well as a comparison with similar homes in the area
Home Values in the Area
Average Home Value in this Area
Purchase History
| Date | Buyer | Sale Price | Title Company |
|---|---|---|---|
| Singh Jagpreet | $640,000 | Amtrust Title | |
| Singh Jagpreet | $640,000 | Amtrust Title | |
| Swaby Pressley | $175,000 | -- | |
| Swaby Pressley | $175,000 | -- | |
| Swaby Pressley | $175,000 | -- | |
| -- | -- | -- | |
| -- | -- | -- | |
| Dawkins Adam H | -- | -- |
Source: Public Records
Mortgage History
| Date | Status | Borrower | Loan Amount |
|---|---|---|---|
| Open | Singh Jagpreet | $465,000 | |
| Closed | Singh Jagpreet | $465,000 | |
| Previous Owner | Swaby Pressley | $173,569 |
Source: Public Records
Tax History Compared to Growth
Tax History
| Year | Tax Paid | Tax Assessment Tax Assessment Total Assessment is a certain percentage of the fair market value that is determined by local assessors to be the total taxable value of land and additions on the property. | Land | Improvement |
|---|---|---|---|---|
| 2025 | $14,813 | $499 | $242 | $257 |
| 2024 | $3,536 | $482 | $242 | $240 |
| 2023 | $14,639 | $482 | $242 | $240 |
| 2022 | $14,639 | $482 | $242 | $240 |
| 2021 | $13,077 | $464 | $233 | $231 |
| 2020 | $12,753 | $660 | $438 | $222 |
| 2019 | $10,434 | $660 | $438 | $222 |
| 2018 | $10,434 | $660 | $0 | $0 |
| 2017 | $7,448 | $660 | $438 | $222 |
| 2016 | $10,089 | $660 | $438 | $222 |
| 2015 | $2,533 | $660 | $438 | $222 |
| 2014 | $2,533 | $660 | $438 | $222 |
| 2013 | $2,377 | $660 | $438 | $222 |
Source: Public Records
Map
Nearby Homes
- 863 Prospect Ave
- 360 Grand St E
- 167 Rushmore St
- 39 4th Ave
- 937 Broadway
- 922 Brush Hollow Rd
- 1005 Broadway
- 153 New York Ave
- 263 Siegel St
- 13 Floral Ln
- 254 Brook St
- 635 Rockland St
- 604 Dartmouth St
- 5 Orient Ct
- 809 Eastfield Rd
- 827 Eastfield Rd
- 806 Pepperidge Rd
- 11 Parkwood Rd
- 49 Middlecamp Rd
- 868 Oliver Ave
- 226 Hopper St Unit 2nd Fl
- 226 Hopper St Unit 1st Fl
- 230 Hopper St
- 221 Swalm St
- 219 Swalm St
- 234 Hopper St
- 225 Swalm St
- 217 Swalm St
- 223 Hopper St
- 221 Hopper St
- 229 Hopper St
- 227 Swalm St
- 217 Hopper St
- 881 Prospect Ave
- 881 Prospect Ave
- 891 Prospect Ave
- 231 Hopper St
- 236 Hopper St
- 233 Hopper St
- 226 Garden St