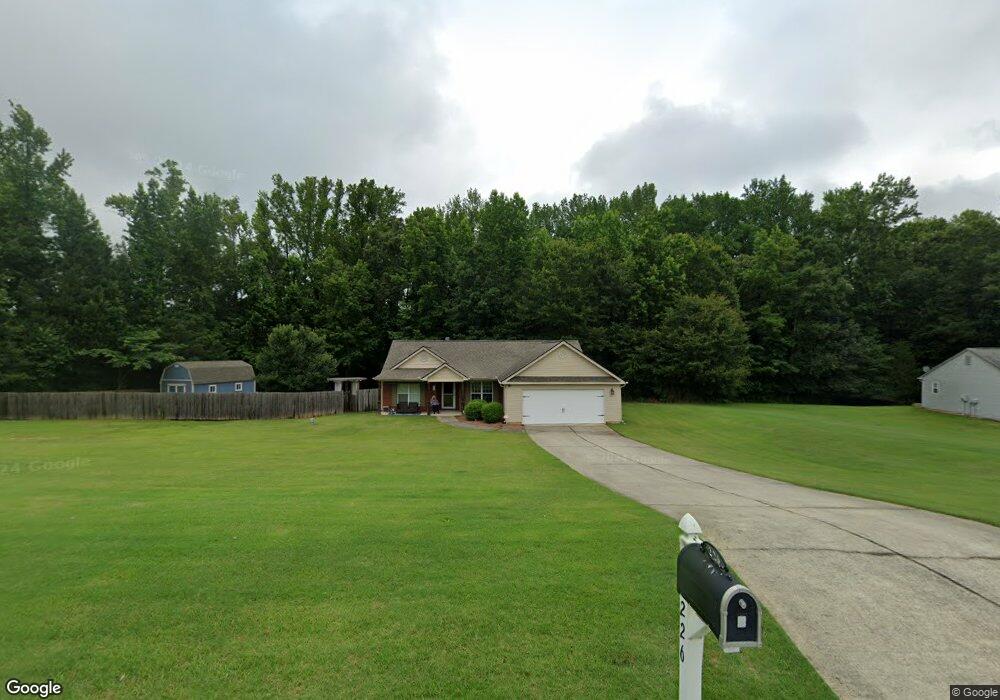
226 Lucas Way Statham, GA 30666
Estimated Value: $319,991 - $337,000
--
Bed
2
Baths
1,444
Sq Ft
$228/Sq Ft
Est. Value
About This Home
This home is located at 226 Lucas Way, Statham, GA 30666 and is currently estimated at $329,498, approximately $228 per square foot. 226 Lucas Way is a home located in Barrow County with nearby schools including Statham Elementary School, Bear Creek Middle School, and Winder-Barrow High School.
Ownership History
Date
Name
Owned For
Owner Type
Purchase Details
Closed on
May 21, 2018
Sold by
Franks Michael
Bought by
Franks Carole
Current Estimated Value
Home Financials for this Owner
Home Financials are based on the most recent Mortgage that was taken out on this home.
Original Mortgage
$159,000
Outstanding Balance
$136,904
Interest Rate
4.4%
Mortgage Type
VA
Estimated Equity
$192,594
Purchase Details
Closed on
Feb 28, 2008
Sold by
Star Hm Bldrs Inc
Bought by
Franks Michael and Franks Malorie
Home Financials for this Owner
Home Financials are based on the most recent Mortgage that was taken out on this home.
Original Mortgage
$120,000
Interest Rate
5.46%
Mortgage Type
New Conventional
Purchase Details
Closed on
Jun 6, 2005
Sold by
Millstone Development Group In
Bought by
Star Home Builders Inc
Purchase Details
Closed on
Sep 6, 2002
Bought by
Millstone Development Group Inc
Create a Home Valuation Report for This Property
The Home Valuation Report is an in-depth analysis detailing your home's value as well as a comparison with similar homes in the area
Home Values in the Area
Average Home Value in this Area
Purchase History
| Date | Buyer | Sale Price | Title Company |
|---|---|---|---|
| Franks Carole | $159,000 | -- | |
| Franks Michael | $120,000 | -- | |
| Star Home Builders Inc | $33,500 | -- | |
| Millstone Development Group Inc | -- | -- |
Source: Public Records
Mortgage History
| Date | Status | Borrower | Loan Amount |
|---|---|---|---|
| Open | Franks Carole | $159,000 | |
| Previous Owner | Franks Michael | $120,000 |
Source: Public Records
Tax History Compared to Growth
Tax History
| Year | Tax Paid | Tax Assessment Tax Assessment Total Assessment is a certain percentage of the fair market value that is determined by local assessors to be the total taxable value of land and additions on the property. | Land | Improvement |
|---|---|---|---|---|
| 2024 | $131 | $107,044 | $24,000 | $83,044 |
| 2023 | $139 | $107,444 | $24,000 | $83,444 |
| 2022 | $132 | $81,041 | $21,600 | $59,441 |
| 2021 | $121 | $63,004 | $16,000 | $47,004 |
| 2020 | $119 | $63,004 | $16,000 | $47,004 |
| 2019 | $119 | $63,004 | $16,000 | $47,004 |
| 2018 | $1,706 | $56,498 | $13,400 | $43,098 |
| 2017 | $1,321 | $45,376 | $13,400 | $31,976 |
| 2016 | $1,311 | $44,712 | $13,400 | $31,312 |
| 2015 | $1,327 | $45,048 | $13,400 | $31,648 |
| 2014 | $1,156 | $39,138 | $7,154 | $31,984 |
| 2013 | -- | $37,552 | $7,154 | $30,398 |
Source: Public Records
Map
Nearby Homes
- 130 Abby Ln
- 116 Windrow Trail
- 110 Chad Walk Unit 56
- 125 Chad Walk Unit 61
- 158 Chad Walk Unit 58
- 140 Chad Walk Unit 57
- 160 Chad Walk Unit 59
- 0 Jefferson Rd Unit 10589312
- 0 Jefferson Rd Unit 10609692
- 00 Jefferson Rd
- 305 Dove Field Dr Unit 80
- 287 Dove Field Dr
- 287 Dove Field Dr Unit 81
- 267 Dove Field Dr Unit 82
- 247 Dove Field Dr Unit 83
- 122 Kinsley Way
- 227 Dove Field Dr Unit 84
- 2464 Savage Rd
- 325 Twin Oaks Cir
- 190 Charlotte Dr
- 232 Lucas Way
- 234 Lucas Way
- 229 Lucas Way
- 231 Lucas Way
- 227 Lucas Way
- 223 Lucas Way
- 233 Lucas Way
- 2517 Marixa Dr
- 2513 Marixa Dr
- 221 Lucas Way
- Tract 10 Bogart Jefferson Rd
- Tract 12 Bogart Jefferson Rd
- Tract 11 Bogart Jefferson Rd
- Tract 8 Bogart Jefferson Rd
- Tract 13 Bogart Jefferson Rd
- Tract 9 Bogart Jefferson Rd
- 235 Lucas Way
- 2521 Marixa Dr
- 219 Lucas Way
- 2488 Hollis Rd