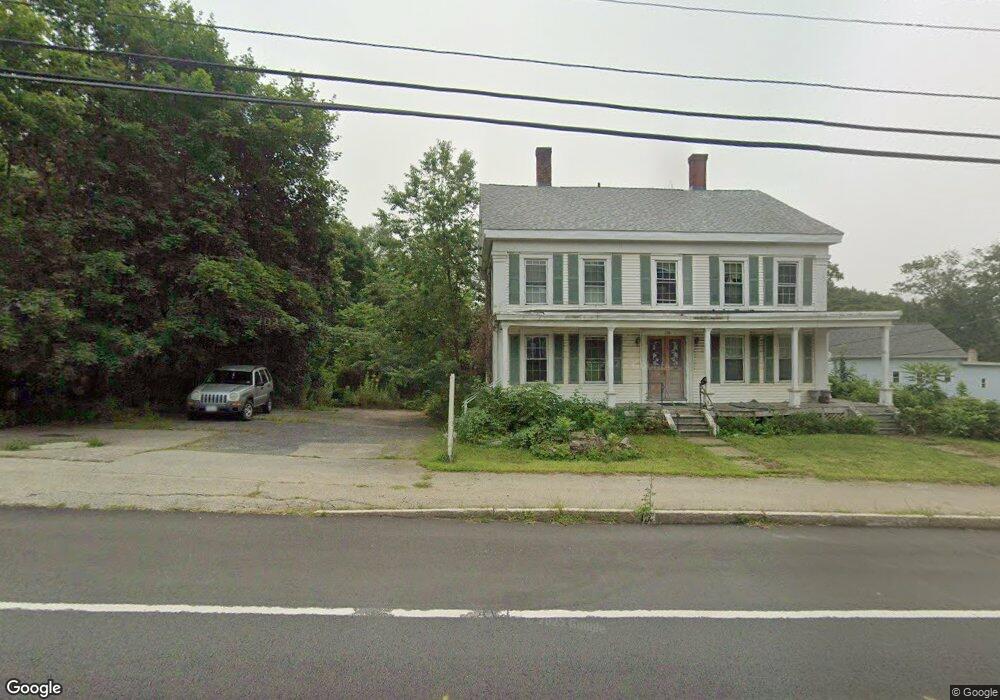
226 Main St Spencer, MA 01562
Estimated Value: $519,000 - $690,000
5
Beds
3
Baths
4,942
Sq Ft
$129/Sq Ft
Est. Value
About This Home
This home is located at 226 Main St, Spencer, MA 01562 and is currently estimated at $635,663, approximately $128 per square foot. 226 Main St is a home located in Worcester County with nearby schools including David Prouty High School.
Ownership History
Date
Name
Owned For
Owner Type
Purchase Details
Closed on
Jul 23, 2015
Sold by
Kauppila Mary A
Bought by
Mary Ann D Kauppila Ft and Baublis Stephen J
Current Estimated Value
Purchase Details
Closed on
Aug 25, 2006
Sold by
Baublis Stephen J
Bought by
Kauppila Mary Ann
Purchase Details
Closed on
Jan 5, 1993
Sold by
Mckeon Gemma
Bought by
Baublis Stephen J
Home Financials for this Owner
Home Financials are based on the most recent Mortgage that was taken out on this home.
Original Mortgage
$30,000
Interest Rate
8.32%
Mortgage Type
Purchase Money Mortgage
Create a Home Valuation Report for This Property
The Home Valuation Report is an in-depth analysis detailing your home's value as well as a comparison with similar homes in the area
Home Values in the Area
Average Home Value in this Area
Purchase History
| Date | Buyer | Sale Price | Title Company |
|---|---|---|---|
| Mary Ann D Kauppila Ft | -- | -- | |
| Kauppila Mary Ann | -- | -- | |
| Baublis Stephen J | $90,000 | -- |
Source: Public Records
Mortgage History
| Date | Status | Borrower | Loan Amount |
|---|---|---|---|
| Previous Owner | Baublis Stephen J | $60,000 | |
| Previous Owner | Baublis Stephen J | $30,000 |
Source: Public Records
Tax History Compared to Growth
Tax History
| Year | Tax Paid | Tax Assessment Tax Assessment Total Assessment is a certain percentage of the fair market value that is determined by local assessors to be the total taxable value of land and additions on the property. | Land | Improvement |
|---|---|---|---|---|
| 2025 | $7,293 | $621,200 | $50,800 | $570,400 |
| 2024 | $6,787 | $593,300 | $50,800 | $542,500 |
| 2023 | $6,403 | $530,900 | $50,800 | $480,100 |
| 2022 | $6,159 | $468,000 | $46,300 | $421,700 |
| 2021 | $6,040 | $430,200 | $46,300 | $383,900 |
| 2020 | $5,686 | $402,700 | $46,300 | $356,400 |
| 2019 | $4,122 | $297,400 | $41,800 | $255,600 |
| 2018 | $3,575 | $266,400 | $48,700 | $217,700 |
| 2017 | $3,689 | $263,900 | $46,300 | $217,600 |
| 2016 | $3,501 | $245,000 | $46,300 | $198,700 |
| 2015 | $3,490 | $255,300 | $51,400 | $203,900 |
| 2014 | $3,357 | $255,300 | $51,400 | $203,900 |
Source: Public Records
Map
Nearby Homes