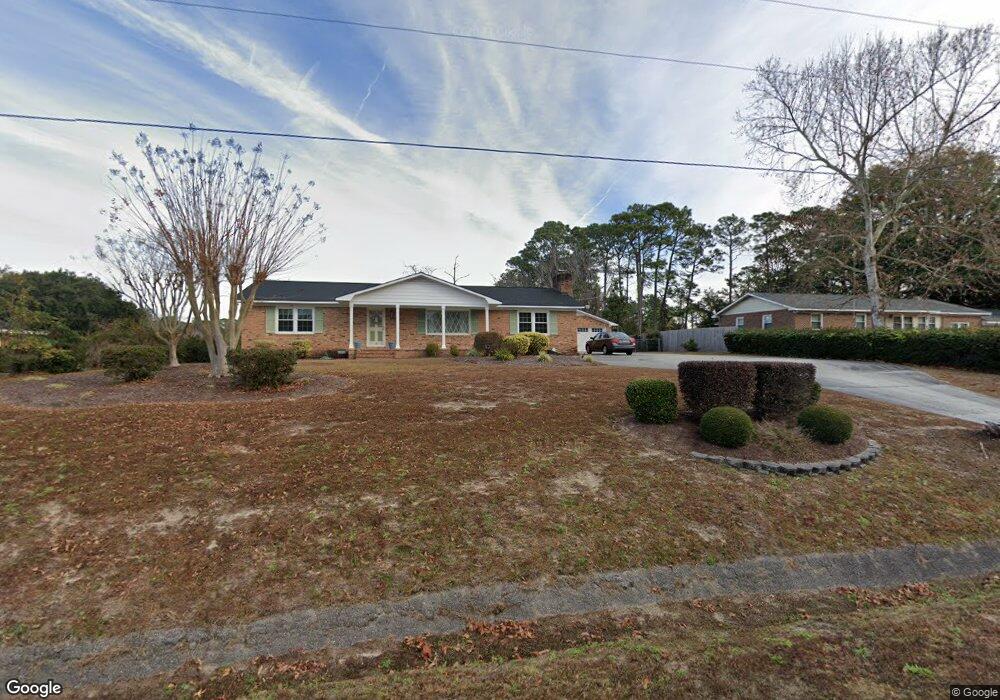
226 Mohawk Trail Wilmington, NC 28409
Tanglewood NeighborhoodEstimated Value: $394,000 - $464,000
3
Beds
2
Baths
1,769
Sq Ft
$242/Sq Ft
Est. Value
About This Home
This home is located at 226 Mohawk Trail, Wilmington, NC 28409 and is currently estimated at $427,624, approximately $241 per square foot. 226 Mohawk Trail is a home located in New Hanover County with nearby schools including Pine Valley Elementary School, Myrtle Grove Middle School, and John T. Hoggard High School.
Ownership History
Date
Name
Owned For
Owner Type
Purchase Details
Closed on
Apr 30, 1996
Sold by
Neeley John A Theresa L
Bought by
Dickson Wayne Amelia
Current Estimated Value
Purchase Details
Closed on
Apr 1, 1992
Sold by
Padgett Lynn Carter
Bought by
Neeley John A Theresa L
Purchase Details
Closed on
Aug 1, 1986
Sold by
Creveling Robert S Diane
Bought by
Padgett Lynn Carter
Purchase Details
Closed on
Oct 1, 1985
Sold by
Brown Larry A Frances B
Bought by
Creveling Robert S Diane
Purchase Details
Closed on
Sep 1, 1984
Sold by
Cook Ralph Helen L
Bought by
Brown Larry A Frances B
Purchase Details
Closed on
Feb 1, 1983
Sold by
Farningham Gilbert Ruby
Bought by
Cook Ralph Helen L
Purchase Details
Closed on
Sep 1, 1980
Sold by
Moxey Daniel J Frances E
Bought by
Farningham Gilbert Ruby
Purchase Details
Closed on
Apr 1, 1979
Bought by
Moxey Daniel J Frances E
Create a Home Valuation Report for This Property
The Home Valuation Report is an in-depth analysis detailing your home's value as well as a comparison with similar homes in the area
Home Values in the Area
Average Home Value in this Area
Purchase History
| Date | Buyer | Sale Price | Title Company |
|---|---|---|---|
| Dickson Wayne Amelia | $123,500 | -- | |
| Neeley John A Theresa L | $78,500 | -- | |
| Padgett Lynn Carter | $71,600 | -- | |
| Creveling Robert S Diane | $76,000 | -- | |
| Brown Larry A Frances B | $67,000 | -- | |
| Cook Ralph Helen L | $67,000 | -- | |
| Farningham Gilbert Ruby | $62,900 | -- | |
| Moxey Daniel J Frances E | $500 | -- |
Source: Public Records
Tax History
| Year | Tax Paid | Tax Assessment Tax Assessment Total Assessment is a certain percentage of the fair market value that is determined by local assessors to be the total taxable value of land and additions on the property. | Land | Improvement |
|---|---|---|---|---|
| 2025 | $1,697 | $428,900 | $169,700 | $259,200 |
| 2023 | $1,509 | $275,900 | $91,700 | $184,200 |
| 2022 | $1,523 | $275,900 | $91,700 | $184,200 |
| 2021 | $1,523 | $275,900 | $91,700 | $184,200 |
| 2020 | $1,242 | $196,300 | $42,400 | $153,900 |
| 2019 | $1,242 | $196,300 | $42,400 | $153,900 |
| 2018 | $1,242 | $196,300 | $42,400 | $153,900 |
| 2017 | $1,271 | $196,300 | $42,400 | $153,900 |
| 2016 | $1,144 | $165,100 | $42,400 | $122,700 |
| 2015 | $1,063 | $165,100 | $42,400 | $122,700 |
| 2014 | $1,045 | $165,100 | $42,400 | $122,700 |
Source: Public Records
Map
Nearby Homes
- 229 Navaho Trail
- 134 Cherokee Trail
- 5904 Headsail Ct
- 141 Mohican Trail
- 4245 Moorland Ln
- 4244 Moorland Ln
- 5021 Out Island Dr
- 4641 Masonboro Loop Rd
- 4921 Crosswinds Dr
- 4511 Masonboro Loop Rd
- 5117 Chalice Ln
- 4906 Glennburn Ct
- 5200 Woods Edge Rd
- 5031 Nicholas Creek Cir
- 4800 Wedgefield Dr
- 4900 Brownlow Cir
- 4903 Trailing Vine Ln
- 221 Friendly Ln
- 3274 Kellerton Place
- 2075 Whiskey Branch Dr
- 222 Mohawk Trail
- 230 Mohawk Trail
- 225 Cherokee Trail
- 229 Cherokee Trail
- 218 Mohawk Trail
- 225 Mohawk Trail
- 221 Cherokee Trail
- 229 Mohawk Trail
- 233 Cherokee Trail
- 238 Mohawk Trail
- 231 Mohawk Trail
- 217 Mohawk Trail
- 214 Mohawk Trail
- 213 Cherokee Trail
- 237 Mohawk Trail
- 213 Mohawk Trail
- 226 Seminole Trail
- 237 Cherokee Trail
- 230 Cherokee Trail
- 230 Seminole Trail
Your Personal Tour Guide
Ask me questions while you tour the home.