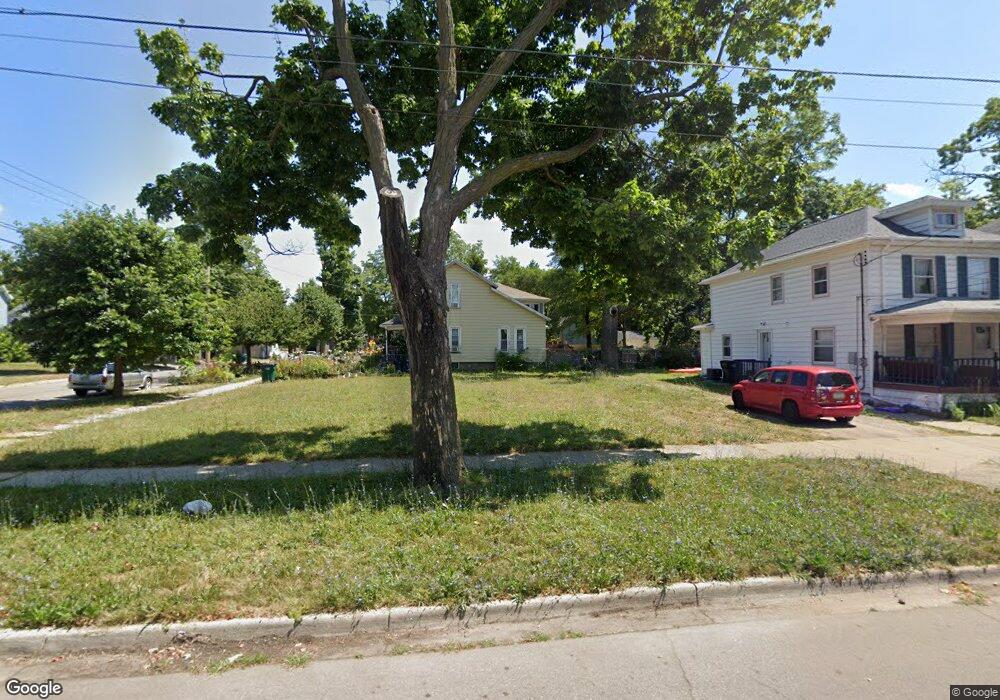
226 N 8th St Lansing, MI 48912
The Stadium District NeighborhoodEstimated Value: $78,000 - $159,000
Studio
3
Baths
1,566
Sq Ft
$84/Sq Ft
Est. Value
About This Home
This home is located at 226 N 8th St, Lansing, MI 48912 and is currently estimated at $131,000, approximately $83 per square foot. 226 N 8th St is a home located in Ingham County with nearby schools including Pattengill Academy, Riddle Elementary School, and Eastern High School.
Ownership History
Date
Name
Owned For
Owner Type
Purchase Details
Closed on
Mar 10, 2022
Sold by
Ekr Homes Llc
Bought by
Wellman Sarah
Current Estimated Value
Purchase Details
Closed on
Dec 15, 2018
Sold by
Eshbaugh Andrew and Reynolds Jessica
Bought by
Ekr Homes Llc
Purchase Details
Closed on
Sep 18, 2018
Sold by
Ingham County Land Bank Fast Track Autho
Bought by
Eshbaugh Andrew and Reynolds Jessica
Purchase Details
Closed on
Nov 24, 2015
Sold by
Schertzing Eric
Bought by
Ingham County Land Bank Fast Track Autho
Purchase Details
Closed on
Aug 17, 2012
Sold by
Bjr Rentals Llc
Bought by
Gomez Home Improvements Inc
Purchase Details
Closed on
May 27, 2010
Sold by
Kufchock Julie A Atkinson
Bought by
Bjr Rentals Llc
Purchase Details
Closed on
Jul 16, 1997
Sold by
Atkinson James Franklyn
Bought by
Atkinson James F Revocable Trust
Create a Home Valuation Report for This Property
The Home Valuation Report is an in-depth analysis detailing your home's value as well as a comparison with similar homes in the area
Home Values in the Area
Average Home Value in this Area
Purchase History
| Date | Buyer | Sale Price | Title Company |
|---|---|---|---|
| Wellman Sarah | $109,900 | None Listed On Document | |
| Ekr Homes Llc | -- | None Available | |
| Eshbaugh Andrew | $1,000 | Cinnaire Title Services | |
| Ingham County Land Bank Fast Track Autho | $5,400 | None Available | |
| Gomez Home Improvements Inc | $3,200 | Stewart Title Agency | |
| Bjr Rentals Llc | -- | None Available | |
| Kufchock Julie A Atkinson | -- | None Available | |
| Atkinson James F Revocable Trust | -- | -- |
Source: Public Records
Tax History
| Year | Tax Paid | Tax Assessment Tax Assessment Total Assessment is a certain percentage of the fair market value that is determined by local assessors to be the total taxable value of land and additions on the property. | Land | Improvement |
|---|---|---|---|---|
| 2025 | $284 | $4,500 | $4,500 | $0 |
| 2024 | $2 | $4,500 | $4,500 | $0 |
| 2023 | $280 | $4,500 | $4,500 | $0 |
| 2022 | $193 | $3,300 | $3,300 | $0 |
| 2021 | $327 | $5,200 | $5,200 | $0 |
| 2020 | $325 | $4,200 | $4,200 | $0 |
| 2019 | $561 | $4,200 | $4,200 | $0 |
| 2018 | $304 | $0 | $0 | $0 |
| 2017 | $304 | $0 | $0 | $0 |
| 2016 | $5,202 | $0 | $0 | $0 |
| 2015 | $5,202 | $22,300 | $8,465 | $13,835 |
| 2014 | $5,202 | $22,400 | $8,465 | $13,935 |
Source: Public Records
Map
Nearby Homes
- 910 Vine St
- 831 Vine St
- 322 Pere Marquette Dr Unit 15
- 433 Dorrance Place
- 207 S Hosmer St
- 209 S Hosmer St
- 1024 Eureka St
- 302 S 8th St
- 500 E Michigan Ave Unit 411
- 617 Worthington Dr Unit 36
- 314 S Bingham St
- 917 E Kalamazoo St
- 911 E Kalamazoo St
- 316 Jones St
- 615 E Kalamazoo St
- 0 S M 43 Hwy
- 649 Worthington Dr Unit 5
- 925 May St
- 1346 Eureka St
- 328 S Holmes St
Your Personal Tour Guide
Ask me questions while you tour the home.