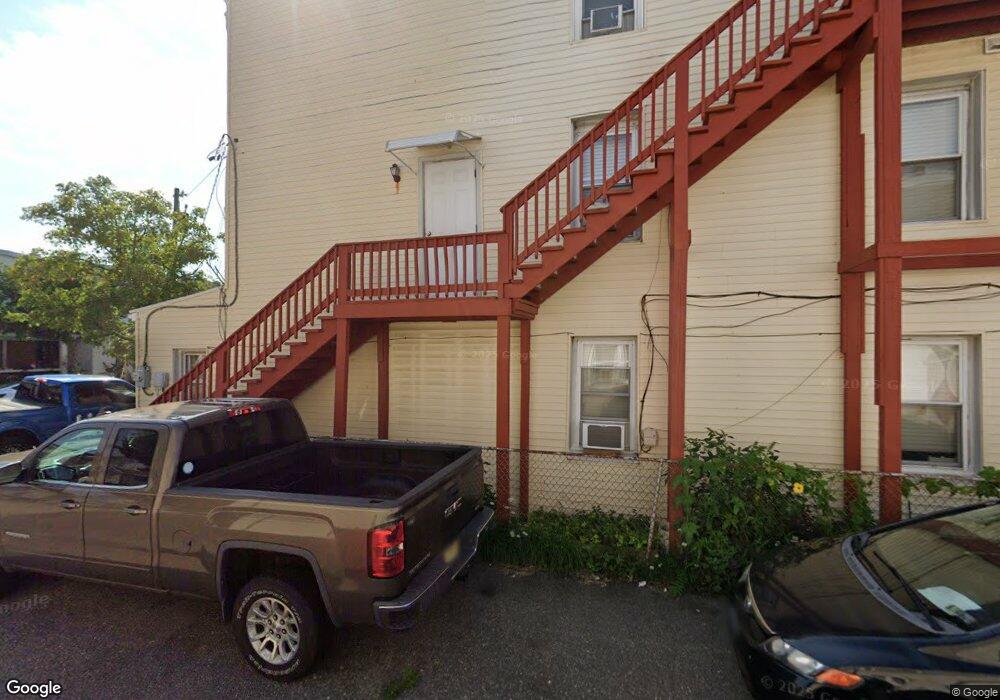
226 N Morris Ave Atlantic City, NJ 08401
Chelsea NeighborhoodEstimated Value: $216,650 - $302,000
--
Bed
--
Bath
1,908
Sq Ft
$139/Sq Ft
Est. Value
About This Home
This home is located at 226 N Morris Ave, Atlantic City, NJ 08401 and is currently estimated at $265,913, approximately $139 per square foot. 226 N Morris Ave is a home located in Atlantic County with nearby schools including Brighton Avenue School, Atlantic City High School, and Our Lady Star of the Sea Regional School.
Ownership History
Date
Name
Owned For
Owner Type
Purchase Details
Closed on
Dec 27, 2011
Sold by
Nguyen Calvin
Bought by
Huynh Hien T
Current Estimated Value
Purchase Details
Closed on
Sep 20, 2005
Sold by
Huyng Jackie
Bought by
Hien Huynh
Home Financials for this Owner
Home Financials are based on the most recent Mortgage that was taken out on this home.
Original Mortgage
$85,000
Interest Rate
5.84%
Mortgage Type
Purchase Money Mortgage
Purchase Details
Closed on
Nov 17, 2004
Sold by
May Alan
Bought by
Huynh Jackie
Create a Home Valuation Report for This Property
The Home Valuation Report is an in-depth analysis detailing your home's value as well as a comparison with similar homes in the area
Home Values in the Area
Average Home Value in this Area
Purchase History
| Date | Buyer | Sale Price | Title Company |
|---|---|---|---|
| Huynh Hien T | -- | None Available | |
| Hien Huynh | $155,000 | -- | |
| Huynh Jackie | $155,000 | -- | |
| Huynh Jackie | $155,000 | -- | |
| Huynh Jackie | $155,000 | -- |
Source: Public Records
Mortgage History
| Date | Status | Borrower | Loan Amount |
|---|---|---|---|
| Previous Owner | Hien Huynh | $85,000 |
Source: Public Records
Tax History Compared to Growth
Tax History
| Year | Tax Paid | Tax Assessment Tax Assessment Total Assessment is a certain percentage of the fair market value that is determined by local assessors to be the total taxable value of land and additions on the property. | Land | Improvement |
|---|---|---|---|---|
| 2025 | $3,076 | $89,100 | $29,300 | $59,800 |
| 2024 | $3,076 | $89,100 | $29,300 | $59,800 |
| 2023 | $3,365 | $89,100 | $29,300 | $59,800 |
| 2022 | $3,365 | $89,100 | $29,300 | $59,800 |
| 2021 | $3,476 | $89,100 | $29,300 | $59,800 |
| 2020 | $3,505 | $89,100 | $29,300 | $59,800 |
| 2019 | $4,104 | $103,000 | $38,000 | $65,000 |
| 2018 | $3,639 | $103,000 | $38,000 | $65,000 |
| 2017 | $3,524 | $103,000 | $38,000 | $65,000 |
| 2016 | $5,211 | $135,000 | $70,000 | $65,000 |
| 2015 | $4,620 | $135,000 | $70,000 | $65,000 |
| 2014 | $4,520 | $135,000 | $70,000 | $65,000 |
Source: Public Records
Map
Nearby Homes
- 2913 Fairmount Ave
- 3107 Fairmount Ave
- 121 N Montpelier Ave
- 121 N Montpelier Ave Unit B
- 113 N Brighton Ave
- 2827 Fenton Place
- 20 N Chelsea Ave
- 2801 Arctic Ave
- 222 N California Ave
- 35 N Boston Ave
- 23 N Boston Ave
- 27 N Iowa Ave
- 2925 Atlantic Ave
- 23 N Boston (Rr) Ave
- 40 N Boston Ave
- 23 N Iowa Ave
- 38 N Boston Ave
- 213 Arizona Ave
- 3424 Winchester Ave
- 205 Arizona Ave
- 222 N Morris Ave
- 224 N Morris Ave
- 220 N Morris Ave
- 3013 Howard Ave
- 3011 Howard Ave
- 3015 Howard Ave
- 3009 Howard Ave
- 218 N Morris Ave
- 216 N Morris Ave
- 214 N Morris Ave
- 219 N Chelsea Ave
- 217 N Chelsea Ave
- 221 N Chelsea Ave
- 215 N Chelsea Ave
- 212 N Morris Ave
- 223 N Chelsea Ave
- 213 N Chelsea Ave
- 228 N Morris Ave
- 210 N Morris Ave
- 211 N Chelsea Ave