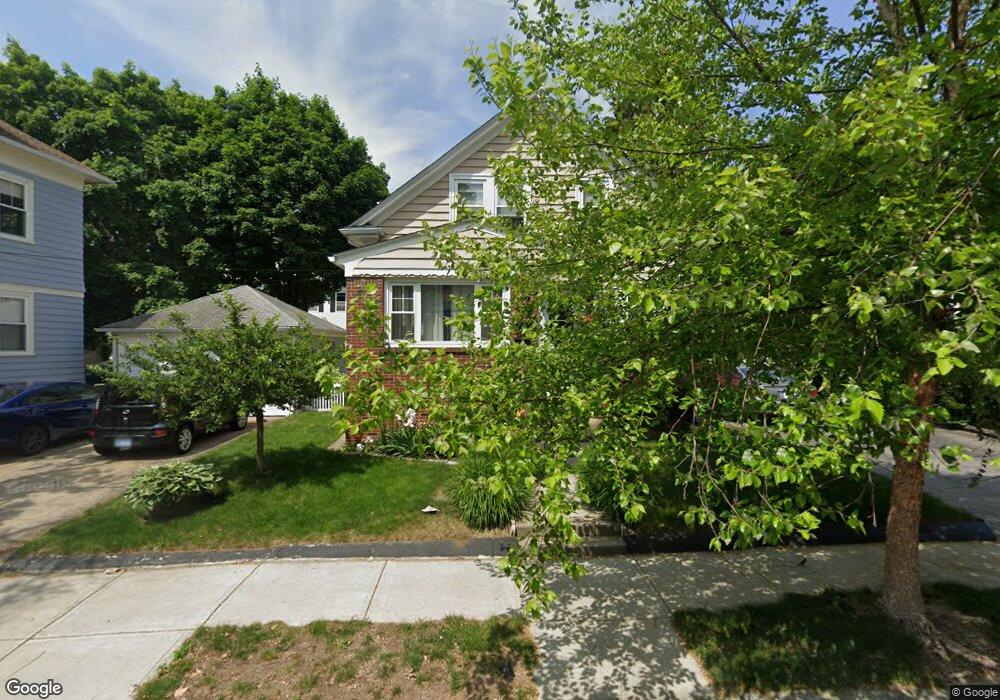
226 Nelson St Providence, RI 02908
Elmhurst NeighborhoodEstimated Value: $416,363 - $574,000
4
Beds
2
Baths
1,952
Sq Ft
$267/Sq Ft
Est. Value
About This Home
This home is located at 226 Nelson St, Providence, RI 02908 and is currently estimated at $520,591, approximately $266 per square foot. 226 Nelson St is a home located in Providence County with nearby schools including St. Augustine School, St. Pius V Catholic School, and Blessed Sacrament School.
Ownership History
Date
Name
Owned For
Owner Type
Purchase Details
Closed on
Jun 5, 2001
Sold by
Enos Daniel
Bought by
Longe David J
Current Estimated Value
Purchase Details
Closed on
May 20, 1992
Sold by
Vallante Rosalie F
Bought by
Enos Daniel
Create a Home Valuation Report for This Property
The Home Valuation Report is an in-depth analysis detailing your home's value as well as a comparison with similar homes in the area
Home Values in the Area
Average Home Value in this Area
Purchase History
| Date | Buyer | Sale Price | Title Company |
|---|---|---|---|
| Longe David J | $136,000 | -- | |
| Enos Daniel | $99,000 | -- |
Source: Public Records
Mortgage History
| Date | Status | Borrower | Loan Amount |
|---|---|---|---|
| Open | Enos Daniel | $50,000 | |
| Closed | Enos Daniel | $36,000 | |
| Open | Enos Daniel | $185,000 |
Source: Public Records
Tax History
| Year | Tax Paid | Tax Assessment Tax Assessment Total Assessment is a certain percentage of the fair market value that is determined by local assessors to be the total taxable value of land and additions on the property. | Land | Improvement |
|---|---|---|---|---|
| 2025 | $3,391 | $449,100 | $160,000 | $289,100 |
| 2024 | $5,819 | $317,100 | $104,000 | $213,100 |
| 2023 | $5,819 | $317,100 | $104,000 | $213,100 |
| 2022 | $5,644 | $317,100 | $104,000 | $213,100 |
| 2021 | $5,182 | $211,000 | $79,300 | $131,700 |
| 2020 | $5,182 | $211,000 | $79,300 | $131,700 |
| 2019 | $5,182 | $211,000 | $79,300 | $131,700 |
| 2018 | $4,474 | $140,000 | $63,800 | $76,200 |
| 2017 | $4,474 | $140,000 | $63,800 | $76,200 |
| 2016 | $4,474 | $140,000 | $63,800 | $76,200 |
| 2015 | $4,214 | $127,300 | $63,800 | $63,500 |
| 2014 | $4,296 | $127,300 | $63,800 | $63,500 |
| 2013 | $4,296 | $127,300 | $63,800 | $63,500 |
Source: Public Records
Map
Nearby Homes
Your Personal Tour Guide
Ask me questions while you tour the home.