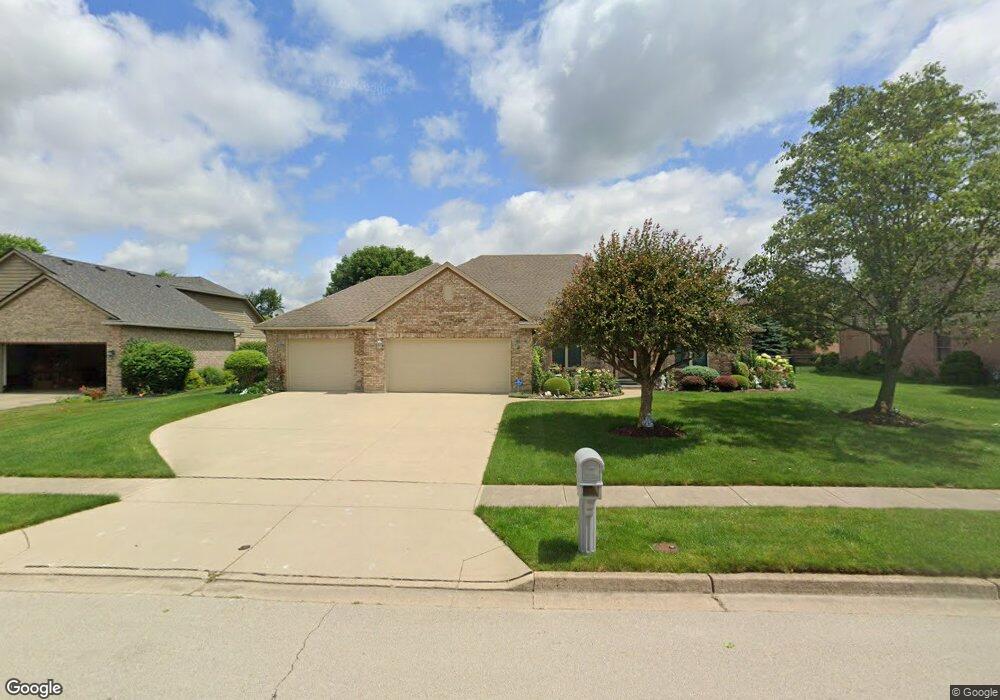
226 Old Carriage Dr Englewood, OH 45322
Estimated Value: $371,000 - $396,000
3
Beds
3
Baths
2,420
Sq Ft
$159/Sq Ft
Est. Value
About This Home
This home is located at 226 Old Carriage Dr, Englewood, OH 45322 and is currently estimated at $383,868, approximately $158 per square foot. 226 Old Carriage Dr is a home located in Montgomery County with nearby schools including Northmont High School and Salem Christian Academy.
Ownership History
Date
Name
Owned For
Owner Type
Purchase Details
Closed on
Jun 30, 2006
Sold by
Wittman Jeffrey G
Bought by
Schwabe Karl E and Yanasuk Pinmance Rai
Current Estimated Value
Home Financials for this Owner
Home Financials are based on the most recent Mortgage that was taken out on this home.
Original Mortgage
$150,000
Interest Rate
6.72%
Mortgage Type
Purchase Money Mortgage
Purchase Details
Closed on
Oct 31, 2005
Sold by
Wittman Jeffrey G and Wittman Julie L
Bought by
Wittman Jeffrey G
Purchase Details
Closed on
Nov 23, 2001
Sold by
Carriage Trail Development Company
Bought by
Wittman Jeffrey G and Wittman Julie L
Home Financials for this Owner
Home Financials are based on the most recent Mortgage that was taken out on this home.
Original Mortgage
$201,600
Interest Rate
6.68%
Mortgage Type
Construction
Create a Home Valuation Report for This Property
The Home Valuation Report is an in-depth analysis detailing your home's value as well as a comparison with similar homes in the area
Home Values in the Area
Average Home Value in this Area
Purchase History
| Date | Buyer | Sale Price | Title Company |
|---|---|---|---|
| Schwabe Karl E | $246,500 | Tri Star Title Agency Of Day | |
| Wittman Jeffrey G | -- | -- | |
| Wittman Jeffrey G | $39,900 | Landmark Title Agency Inc |
Source: Public Records
Mortgage History
| Date | Status | Borrower | Loan Amount |
|---|---|---|---|
| Closed | Schwabe Karl E | $150,000 | |
| Previous Owner | Wittman Jeffrey G | $201,600 |
Source: Public Records
Tax History Compared to Growth
Tax History
| Year | Tax Paid | Tax Assessment Tax Assessment Total Assessment is a certain percentage of the fair market value that is determined by local assessors to be the total taxable value of land and additions on the property. | Land | Improvement |
|---|---|---|---|---|
| 2024 | $5,693 | $100,070 | $18,430 | $81,640 |
| 2023 | $5,693 | $100,070 | $18,430 | $81,640 |
| 2022 | $6,317 | $85,530 | $15,750 | $69,780 |
| 2021 | $6,335 | $85,530 | $15,750 | $69,780 |
| 2020 | $6,220 | $85,530 | $15,750 | $69,780 |
| 2019 | $6,461 | $79,700 | $15,750 | $63,950 |
| 2018 | $6,343 | $79,700 | $15,750 | $63,950 |
| 2017 | $6,278 | $79,700 | $15,750 | $63,950 |
| 2016 | $6,347 | $79,180 | $15,750 | $63,430 |
| 2015 | $5,799 | $79,180 | $15,750 | $63,430 |
| 2014 | $5,799 | $79,180 | $15,750 | $63,430 |
| 2012 | -- | $74,710 | $17,500 | $57,210 |
Source: Public Records
Map
Nearby Homes
- 604 Heather St
- 414 Rankin Dr
- 408 W Herr St
- 322 Rankin Dr
- 321 Rankin Dr
- 4005 Clearstream Way
- 332 Beckenham Rd
- 320 Camborne Dr
- 308 Magnolia Ave
- 114 Brumbaugh Ct
- 106 Warner Dr
- 118 Elm Ct
- 128 Union Ridge Dr
- 2004 Clearstream Way
- 430 N Main St
- 308 Sagebrush Dr
- 63 Sweet Potato Ridge Rd
- 402 Bramlage Ln
- 123 Chestnut St
- 128 Lightner Ln
- 228 Old Carriage Dr
- 4001 Farrier Dr
- 4005 Farrier Dr
- 421 Beechgrove Dr
- 230 Old Carriage Dr
- 227 Old Carriage Dr
- 225 Old Carriage Dr
- 419 Beechgrove Dr
- 223 Old Carriage Dr
- 232 Old Carriage Dr
- 423 Beechgrove Dr
- 222 Old Carriage Dr
- 3002 Mares Ct
- 3001 Mares Ct
- 221 Old Carriage Dr
- 4004 Farrier Dr
- 4006 Farrier Dr
- 4002 Farrier Dr
- 234 Old Carriage Dr
- 415 Beechgrove Dr