Estimated Value: $683,000 - $799,000
6
Beds
4
Baths
2,770
Sq Ft
$273/Sq Ft
Est. Value
About This Home
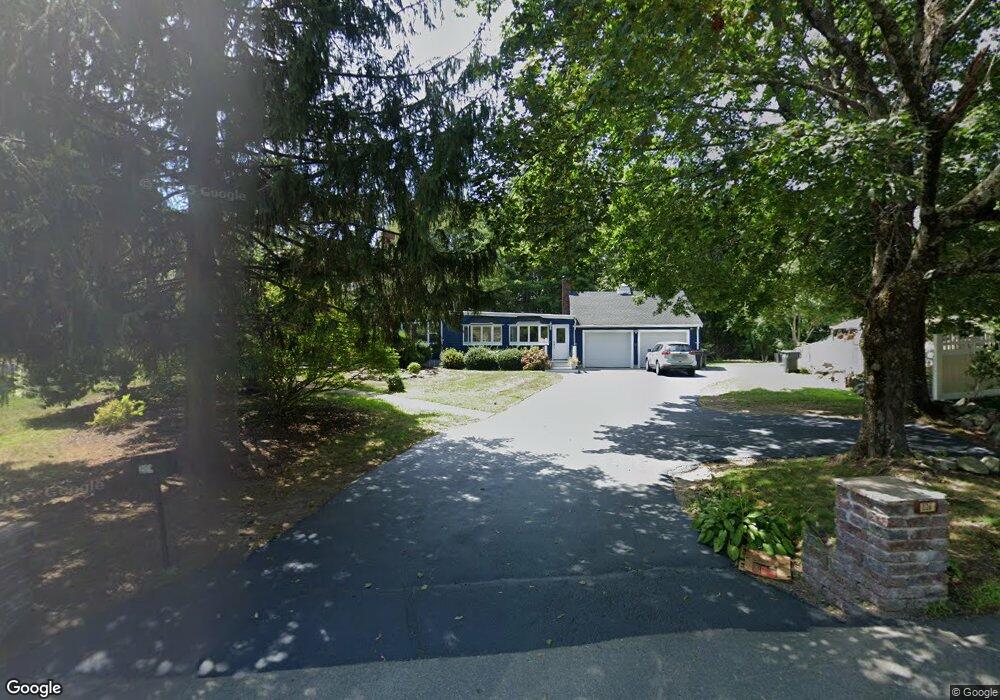
This home is located at 226 Page St, Avon, MA 02322 and is currently estimated at $755,506, approximately $272 per square foot. 226 Page St is a home located in Norfolk County with nearby schools including Ralph D. Butler Elementary School, Avon Middle/High School, and Lighthouse Baptist Christian Academy.
Ownership History
Date
Name
Owned For
Owner Type
Purchase Details
Closed on
Oct 3, 2005
Sold by
Swanson-Hook Family In and Hook Richard A
Bought by
Desousa Manuel
Current Estimated Value
Home Financials for this Owner
Home Financials are based on the most recent Mortgage that was taken out on this home.
Original Mortgage
$332,000
Outstanding Balance
$178,597
Interest Rate
5.84%
Mortgage Type
Purchase Money Mortgage
Estimated Equity
$576,909
Create a Home Valuation Report for This Property
The Home Valuation Report is an in-depth analysis detailing your home's value as well as a comparison with similar homes in the area
Home Values in the Area
Average Home Value in this Area
Purchase History
| Date | Buyer | Sale Price | Title Company |
|---|---|---|---|
| Desousa Manuel | $415,000 | -- |
Source: Public Records
Mortgage History
| Date | Status | Borrower | Loan Amount |
|---|---|---|---|
| Open | Desousa Manuel | $332,000 | |
| Closed | Desousa Manuel | $83,000 |
Source: Public Records
Tax History
| Year | Tax Paid | Tax Assessment Tax Assessment Total Assessment is a certain percentage of the fair market value that is determined by local assessors to be the total taxable value of land and additions on the property. | Land | Improvement |
|---|---|---|---|---|
| 2025 | $86 | $645,500 | $210,300 | $435,200 |
| 2024 | $8,226 | $586,300 | $199,400 | $386,900 |
| 2023 | $7,985 | $586,300 | $199,400 | $386,900 |
| 2022 | $8,065 | $510,100 | $166,000 | $344,100 |
| 2021 | $6,836 | $407,400 | $150,600 | $256,800 |
| 2020 | $6,445 | $364,100 | $147,700 | $216,400 |
| 2019 | $6,708 | $372,900 | $147,700 | $225,200 |
| 2018 | $6,849 | $369,200 | $147,700 | $221,500 |
| 2017 | $5,545 | $320,900 | $147,700 | $173,200 |
| 2016 | $6,243 | $364,900 | $147,700 | $217,200 |
| 2015 | $5,528 | $337,700 | $134,200 | $203,500 |
Source: Public Records
Map
Nearby Homes
Your Personal Tour Guide
Ask me questions while you tour the home.