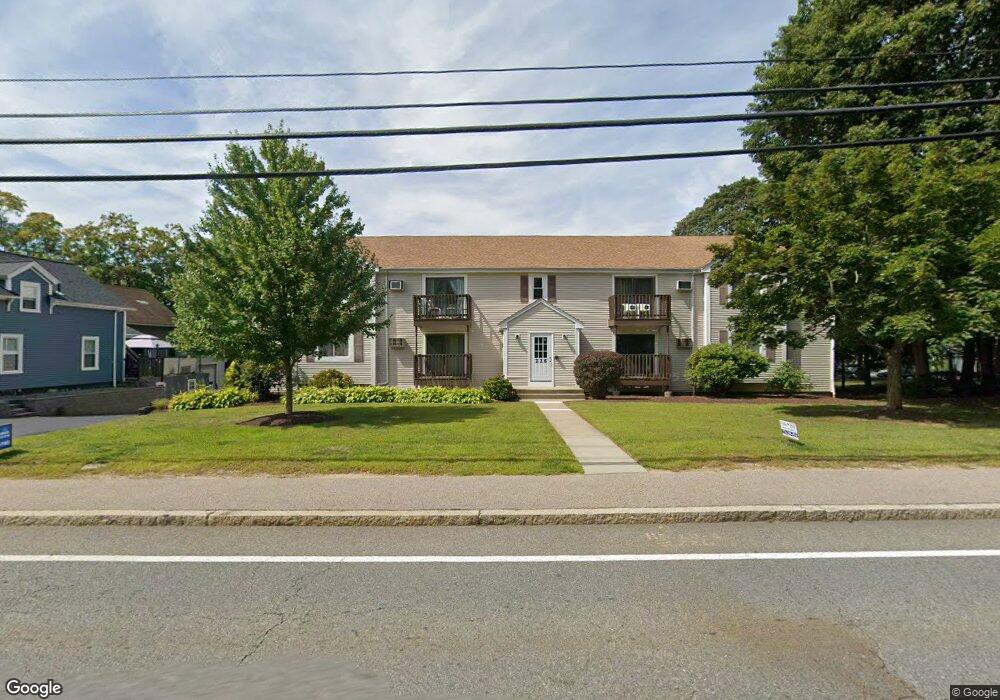
226 Park St Unit 5 North Attleboro, MA 02760
North Attleboro NeighborhoodEstimated Value: $287,000 - $386,000
2
Beds
1
Bath
986
Sq Ft
$326/Sq Ft
Est. Value
About This Home
This home is located at 226 Park St Unit 5, North Attleboro, MA 02760 and is currently estimated at $321,840, approximately $326 per square foot. 226 Park St Unit 5 is a home located in Bristol County with nearby schools including North Attleboro High School and Cadence Academy Preschool - North Attleborough.
Ownership History
Date
Name
Owned For
Owner Type
Purchase Details
Closed on
Oct 16, 2017
Sold by
Shawish Mahmoud F
Bought by
Abu-Rajab Rula
Current Estimated Value
Purchase Details
Closed on
Dec 27, 2002
Sold by
Coelho Anthony M and Coelho Paula S
Bought by
Shawish Mahmoud F and Abu Rajad Rula
Home Financials for this Owner
Home Financials are based on the most recent Mortgage that was taken out on this home.
Original Mortgage
$84,000
Interest Rate
6.02%
Mortgage Type
Purchase Money Mortgage
Purchase Details
Closed on
Oct 31, 1989
Sold by
Tremblay Omer A
Bought by
Coelho Anthony M
Home Financials for this Owner
Home Financials are based on the most recent Mortgage that was taken out on this home.
Original Mortgage
$60,000
Interest Rate
9.94%
Mortgage Type
Purchase Money Mortgage
Create a Home Valuation Report for This Property
The Home Valuation Report is an in-depth analysis detailing your home's value as well as a comparison with similar homes in the area
Home Values in the Area
Average Home Value in this Area
Purchase History
| Date | Buyer | Sale Price | Title Company |
|---|---|---|---|
| Abu-Rajab Rula | -- | -- | |
| Shawish Mahmoud F | $105,000 | -- | |
| Coelho Anthony M | $85,000 | -- |
Source: Public Records
Mortgage History
| Date | Status | Borrower | Loan Amount |
|---|---|---|---|
| Previous Owner | Shawish Mahmoud F | $84,000 | |
| Previous Owner | Coelho Anthony M | $60,000 | |
| Previous Owner | Coelho Anthony M | $40,000 |
Source: Public Records
Tax History Compared to Growth
Tax History
| Year | Tax Paid | Tax Assessment Tax Assessment Total Assessment is a certain percentage of the fair market value that is determined by local assessors to be the total taxable value of land and additions on the property. | Land | Improvement |
|---|---|---|---|---|
| 2025 | $2,564 | $217,500 | $0 | $217,500 |
| 2024 | $2,545 | $220,500 | $0 | $220,500 |
| 2023 | $2,448 | $191,400 | $0 | $191,400 |
| 2022 | $1,931 | $138,600 | $0 | $138,600 |
| 2021 | $2,016 | $141,300 | $0 | $141,300 |
| 2020 | $1,923 | $134,000 | $0 | $134,000 |
| 2019 | $1,699 | $119,300 | $0 | $119,300 |
| 2018 | $1,591 | $119,300 | $0 | $119,300 |
| 2017 | $1,577 | $119,300 | $0 | $119,300 |
| 2016 | $1,453 | $109,900 | $0 | $109,900 |
| 2015 | $1,444 | $109,900 | $0 | $109,900 |
| 2014 | $1,544 | $116,600 | $0 | $116,600 |
Source: Public Records
Map
Nearby Homes
- 35-R Whiting St
- 45 Moran St
- 64 Smith St
- 271 N Washington St
- 2 Franklin Ave
- 34 Hawthorne St
- 194 Smith St
- 157 Fisher St
- 39 Columbia St
- 633 E Washington St Unit 17
- 835 Mt Hope St Unit 39
- 29 Broad St
- 68 N Washington St Unit 210
- 105 East St
- 19 Church St Unit C9
- 19 Valerie Dr
- 0 Landry 2nd Unit 73350867
- 12 Houde St
- 9 Sunnyside Dr Unit 9
- 93 Bank St
- 226 Park St Unit 11
- 226 Park St Unit 10
- 226 Park St Unit 9
- 226 Park St Unit 8
- 226 Park St Unit 7
- 226 Park St Unit 6
- 226 Park St Unit 4
- 226 Park St Unit 3
- 226 Park St Unit 2
- 226 Park St Unit 1
- 226 Park St
- 226 Park St Unit 11,226
- 222 Park St
- 1 Alden Dr
- 235 Park St
- 239 Park St
- 218 Park St
- 244 Park St Unit A3
- 244 Park St Unit A2
- 244 Park St