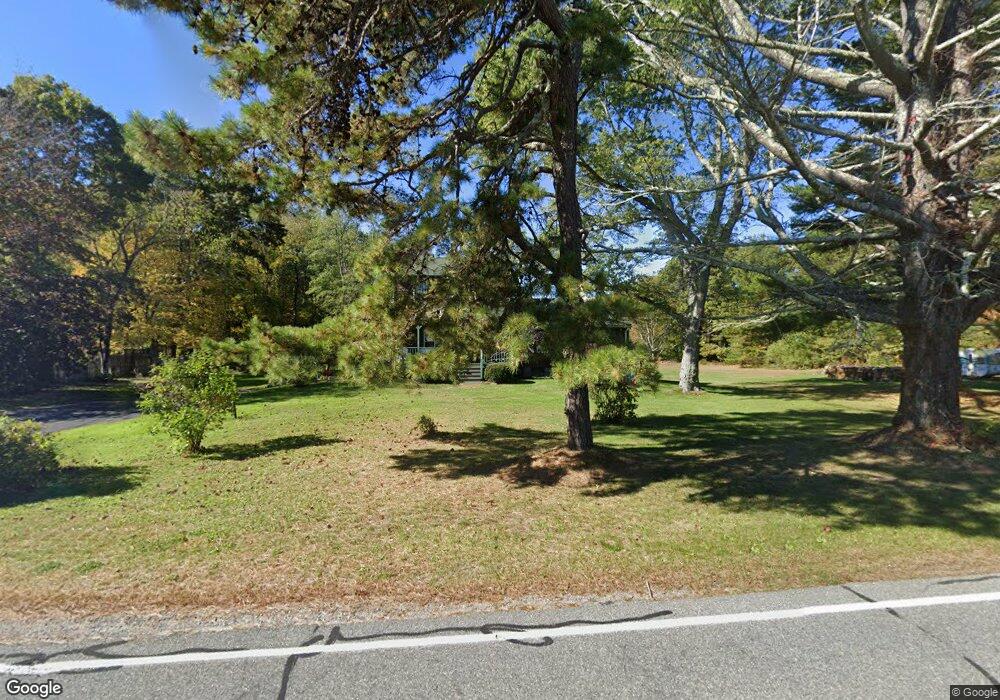
226 Plain St Rehoboth, MA 02769
Estimated Value: $494,379 - $645,000
3
Beds
2
Baths
1,922
Sq Ft
$288/Sq Ft
Est. Value
About This Home
This home is located at 226 Plain St, Rehoboth, MA 02769 and is currently estimated at $552,845, approximately $287 per square foot. 226 Plain St is a home located in Bristol County with nearby schools including Dighton-Rehoboth Regional High School.
Ownership History
Date
Name
Owned For
Owner Type
Purchase Details
Closed on
Aug 3, 2021
Sold by
Malloch Const Co Inc
Bought by
Raymond Ruth S and Adelin-Raymond Neyson G
Current Estimated Value
Home Financials for this Owner
Home Financials are based on the most recent Mortgage that was taken out on this home.
Original Mortgage
$496,945
Outstanding Balance
$450,132
Interest Rate
2.93%
Mortgage Type
Purchase Money Mortgage
Estimated Equity
$102,713
Purchase Details
Closed on
Feb 23, 2021
Sold by
Taunton Land Co Llc
Bought by
Malloch Const Co Inc
Purchase Details
Closed on
May 8, 1992
Sold by
Christian Life Flwshp
Bought by
Rabbitt Anthony
Home Financials for this Owner
Home Financials are based on the most recent Mortgage that was taken out on this home.
Original Mortgage
$60,000
Interest Rate
8.91%
Mortgage Type
Purchase Money Mortgage
Create a Home Valuation Report for This Property
The Home Valuation Report is an in-depth analysis detailing your home's value as well as a comparison with similar homes in the area
Home Values in the Area
Average Home Value in this Area
Purchase History
| Date | Buyer | Sale Price | Title Company |
|---|---|---|---|
| Raymond Ruth S | $523,100 | None Available | |
| Malloch Const Co Inc | -- | None Available | |
| Malloch Const Co Inc | -- | None Available | |
| Rabbitt Anthony | $100,000 | -- | |
| Rabbitt Anthony | $100,000 | -- |
Source: Public Records
Mortgage History
| Date | Status | Borrower | Loan Amount |
|---|---|---|---|
| Open | Raymond Ruth S | $496,945 | |
| Previous Owner | Rabbitt Anthony | $60,000 |
Source: Public Records
Tax History Compared to Growth
Tax History
| Year | Tax Paid | Tax Assessment Tax Assessment Total Assessment is a certain percentage of the fair market value that is determined by local assessors to be the total taxable value of land and additions on the property. | Land | Improvement |
|---|---|---|---|---|
| 2025 | $45 | $400,000 | $172,800 | $227,200 |
| 2024 | $4,570 | $402,300 | $172,800 | $229,500 |
| 2023 | $4,524 | $390,700 | $169,200 | $221,500 |
| 2022 | $4,063 | $320,700 | $169,200 | $151,500 |
| 2021 | $9,034 | $310,000 | $161,400 | $148,600 |
| 2020 | $3,893 | $296,700 | $161,400 | $135,300 |
| 2018 | $3,706 | $283,400 | $153,600 | $129,800 |
| 2017 | $3,560 | $283,400 | $153,600 | $129,800 |
| 2016 | $3,443 | $283,400 | $153,600 | $129,800 |
| 2015 | $3,294 | $267,600 | $146,400 | $121,200 |
| 2014 | $3,136 | $252,100 | $139,200 | $112,900 |
Source: Public Records
Map
Nearby Homes
- 232 Plain St
- 221 Plain St
- 221 Plain St Unit 1
- 227 Plain St Unit 300
- 227 Plain St
- 238 Plain St
- 217 Plain St
- 58 Tiger Lily Trail
- 215 Plain St
- 235 Plain St
- 54 Tiger Lily Trail
- 245 Plain St
- 37 Martin St
- 50 Tiger Lily Trail
- 244 Plain St
- 51 Tiger Lily Trail
- 211 Plain St
- 21 Martin St
- 25 Martin St
- 46 Tiger Lily Trail