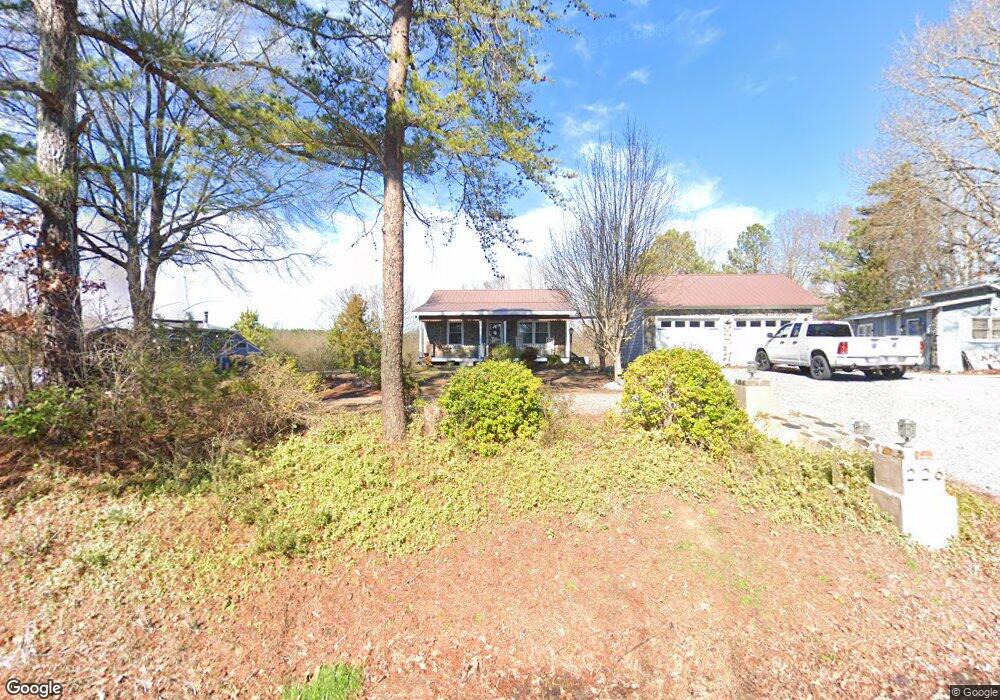
226 Roberts Chapel Church Rd Goldston, NC 27252
Estimated Value: $188,000 - $309,000
3
Beds
2
Baths
1,412
Sq Ft
$171/Sq Ft
Est. Value
About This Home
This home is located at 226 Roberts Chapel Church Rd, Goldston, NC 27252 and is currently estimated at $242,155, approximately $171 per square foot. 226 Roberts Chapel Church Rd is a home located in Chatham County with nearby schools including J.S. Waters Elementary School and Chatham Central High.
Ownership History
Date
Name
Owned For
Owner Type
Purchase Details
Closed on
Feb 19, 2019
Sold by
Cheek Sidney and Cheek Julie
Bought by
Cheek Sidney and Farrington Cheek Julie A
Current Estimated Value
Home Financials for this Owner
Home Financials are based on the most recent Mortgage that was taken out on this home.
Original Mortgage
$151,353
Outstanding Balance
$133,066
Interest Rate
4.5%
Mortgage Type
FHA
Estimated Equity
$109,089
Purchase Details
Closed on
Jan 11, 2016
Sold by
Cheek Vickie L and Cheek Sydney
Bought by
Cheek Sidney and Cheek Julie
Home Financials for this Owner
Home Financials are based on the most recent Mortgage that was taken out on this home.
Original Mortgage
$121,500
Interest Rate
3.75%
Mortgage Type
New Conventional
Purchase Details
Closed on
Jul 6, 1998
Bought by
Cheek Vickie L and Cheek Sydney
Create a Home Valuation Report for This Property
The Home Valuation Report is an in-depth analysis detailing your home's value as well as a comparison with similar homes in the area
Home Values in the Area
Average Home Value in this Area
Purchase History
| Date | Buyer | Sale Price | Title Company |
|---|---|---|---|
| Cheek Sidney | -- | Progressive Land Title Agenc | |
| Cheek Sidney | -- | Attorney | |
| Cheek Vickie L | -- | -- |
Source: Public Records
Mortgage History
| Date | Status | Borrower | Loan Amount |
|---|---|---|---|
| Open | Cheek Sidney | $151,353 | |
| Closed | Cheek Sidney | $121,500 |
Source: Public Records
Tax History Compared to Growth
Tax History
| Year | Tax Paid | Tax Assessment Tax Assessment Total Assessment is a certain percentage of the fair market value that is determined by local assessors to be the total taxable value of land and additions on the property. | Land | Improvement |
|---|---|---|---|---|
| 2024 | $1,643 | $124,043 | $33,725 | $90,318 |
| 2023 | $1,371 | $124,043 | $33,725 | $90,318 |
| 2022 | $1,248 | $124,043 | $33,725 | $90,318 |
| 2021 | $1,248 | $124,043 | $33,725 | $90,318 |
| 2020 | $1,295 | $128,520 | $26,750 | $101,770 |
| 2019 | $1,295 | $128,520 | $26,750 | $101,770 |
| 2018 | $1,241 | $128,520 | $26,750 | $101,770 |
| 2017 | $1,184 | $128,520 | $26,750 | $101,770 |
| 2016 | $1,083 | $109,601 | $26,750 | $82,851 |
| 2015 | $1,059 | $109,601 | $26,750 | $82,851 |
| 2014 | $1,059 | $109,601 | $26,750 | $82,851 |
| 2013 | -- | $109,601 | $26,750 | $82,851 |
Source: Public Records
Map
Nearby Homes
- 676 Roberts Chapel Church Rd
- 0 Pineview Rd Unit 1131027
- Tbd Walnut Springs
- 0 Walter Lambert Rd (C2)
- 2363 Bear Creek Church Rd
- 2684 Saint Lukes Church Rd
- 0 Horton Rd Unit 24291688
- 0 Horton Rd Unit 100496609
- 0 Horton Rd Unit 1174762
- 0 Horton Rd Unit 10084516
- TBD St Luke Church Rd
- 172 Morning Glory Ln
- 0 S Us 301 Hwy Unit 10097976
- 1433 Ralph Moore Rd
- 191 Newell Ln
- 1403 Lakewood Falls Rd
- 33 Holly Run
- 317 Wood Rd
- 9646 Nc Highway 902
- 0 S Plank (Track 2) Rd
- 146 Roberts Chapel Church Rd
- 98 Roberts Chapel Church Rd
- 253 Roberts Chapel Church Rd
- 49 Roberts Chapel Church Rd
- 758 Church St
- 1040 Goldston Carbonton Rd
- 758 S Church St
- 886 Goldston Carbonton Rd
- 1060 Goldston Carbonton Rd
- 1080 Goldston Carbonton Rd
- 740 S Church St
- 821 S Church St
- 0 Goldston Carbonton Rd Unit 11398467
- 0 Goldston Carbonton Rd Unit 100473142
- 0 Goldston Carbonton Rd Unit 100421619
- 3703 Goldston Carbonton Rd
- 0 Goldston Carbonton Rd Unit 1795631
- 0000 Goldston Carbonton Rd
- 0 Goldston Carbonton Rd Unit 1702120
- 0 Goldston Carbonton Rd Unit 901972