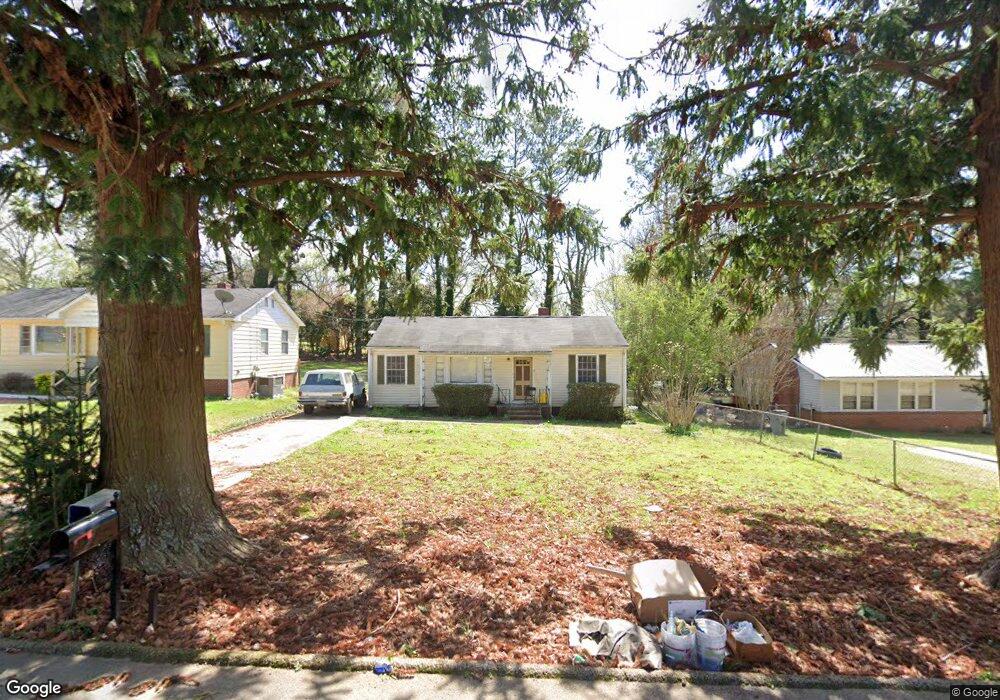
226 Rutland Cir Lagrange, GA 30241
Estimated Value: $120,000 - $157,000
2
Beds
1
Bath
1,022
Sq Ft
$127/Sq Ft
Est. Value
About This Home
This home is located at 226 Rutland Cir, Lagrange, GA 30241 and is currently estimated at $130,107, approximately $127 per square foot. 226 Rutland Cir is a home located in Troup County with nearby schools including Franklin Forest Elementary School, Hollis Hand Elementary School, and Ethel W. Kight Elementary School.
Ownership History
Date
Name
Owned For
Owner Type
Purchase Details
Closed on
Nov 18, 2020
Sold by
Roberts Barry F
Bought by
Brown Tina Olivia
Current Estimated Value
Home Financials for this Owner
Home Financials are based on the most recent Mortgage that was taken out on this home.
Original Mortgage
$9,000
Interest Rate
2.8%
Mortgage Type
New Conventional
Purchase Details
Closed on
Nov 12, 2010
Sold by
Roberts Willis Alton
Bought by
Roberts Barry F
Purchase Details
Closed on
Aug 30, 1996
Sold by
William Luther Jones
Bought by
Roberts Willis A
Purchase Details
Closed on
Feb 26, 1970
Sold by
Daniel Realty & Insurance Agen
Bought by
William Luther Jones
Purchase Details
Closed on
Feb 1, 1970
Sold by
Costley Melvin R
Bought by
Daniel Realty & Insurance Agen
Purchase Details
Closed on
Dec 1, 1968
Sold by
Trammell Charles E and Trammell Martha
Bought by
Costley Melvin R
Create a Home Valuation Report for This Property
The Home Valuation Report is an in-depth analysis detailing your home's value as well as a comparison with similar homes in the area
Home Values in the Area
Average Home Value in this Area
Purchase History
| Date | Buyer | Sale Price | Title Company |
|---|---|---|---|
| Brown Tina Olivia | $20,000 | -- | |
| Roberts Barry F | -- | -- | |
| Roberts Willis A | $100 | -- | |
| William Luther Jones | $1,000 | -- | |
| Daniel Realty & Insurance Agen | -- | -- | |
| Costley Melvin R | $10,500 | -- | |
| Trammell Charles E | $10,500 | -- |
Source: Public Records
Mortgage History
| Date | Status | Borrower | Loan Amount |
|---|---|---|---|
| Closed | Brown Tina Olivia | $9,000 |
Source: Public Records
Tax History Compared to Growth
Tax History
| Year | Tax Paid | Tax Assessment Tax Assessment Total Assessment is a certain percentage of the fair market value that is determined by local assessors to be the total taxable value of land and additions on the property. | Land | Improvement |
|---|---|---|---|---|
| 2024 | $964 | $35,360 | $8,000 | $27,360 |
| 2023 | $898 | $32,920 | $6,360 | $26,560 |
| 2022 | $846 | $30,320 | $6,360 | $23,960 |
| 2021 | $732 | $24,280 | $6,360 | $17,920 |
| 2020 | $432 | $24,280 | $6,360 | $17,920 |
| 2019 | $293 | $19,668 | $5,724 | $13,944 |
| 2018 | $293 | $19,668 | $5,724 | $13,944 |
| 2017 | $293 | $19,668 | $5,724 | $13,944 |
| 2016 | $280 | $19,247 | $5,724 | $13,523 |
| 2015 | $281 | $19,247 | $5,724 | $13,523 |
| 2014 | $257 | $18,451 | $5,724 | $12,727 |
| 2013 | -- | $19,494 | $5,724 | $13,770 |
Source: Public Records
Map
Nearby Homes
- 210 Hearthstone Dr
- 130 Clara Jean Ct
- 121 Ct
- 618 S Harlem Cir
- 616 S Harlem Cir
- 706 N Harlem Cir
- 305 Lenox Cir
- 5 Curran Ave
- 608 S Harlem Cir
- 226 Lenox Cir
- 606 S Harlem Cir
- 105 Lenox Cir
- 101 Lenox Cir
- 0 N Barnard Ave
- 600 S Harlem Cir
- 131 Foch St
- 121 de Groat St
- 906 Georgia Ave
- 902 Georgia Ave
- 109 Dogwood Dr
- 228 Rutland Cir
- 224 Rutland Cir
- 230 Rutland Cir Unit 6
- 230 Rutland Cir
- 247 Rutland Cir
- 249 Rutland Cir
- 251 Rutland Cir
- 208 Rutland Cir
- 206 Rutland Cir
- 210 Rutland Cir
- 232 Rutland Cir
- 204 Rutland Cir
- 204 Rutland Cir Unit 19
- 220 Rutland Cir
- 216 Rutland Cir
- 245 Rutland Cir
- 253 Rutland Cir
- 202 Rutland Cir
- 243 Rutland Cir
- 234 Rutland Cir