Estimated Value: $54,713 - $73,000
2
Beds
2
Baths
1,180
Sq Ft
$56/Sq Ft
Est. Value
About This Home
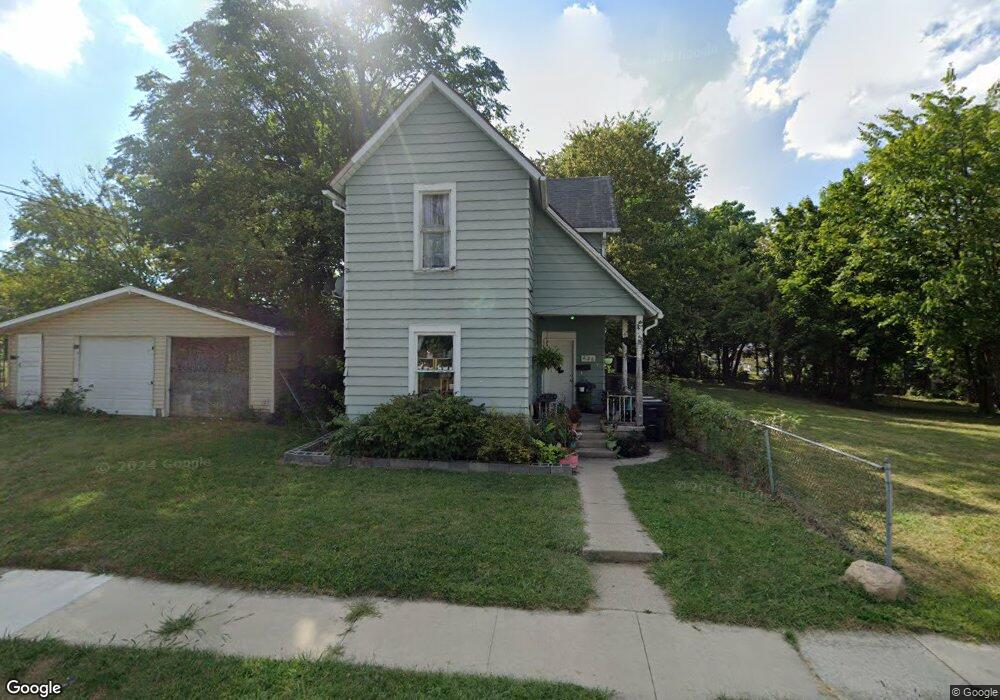
This home is located at 226 S Scott St, Lima, OH 45804 and is currently estimated at $66,238, approximately $56 per square foot. 226 S Scott St is a home located in Allen County with nearby schools including Freedom Elementary School, Lima North Middle School, and Lima West Middle School.
Ownership History
Date
Name
Owned For
Owner Type
Purchase Details
Closed on
Jan 11, 2012
Sold by
Scott Douglas and Scott Angela
Bought by
Pittman Nicholas J
Current Estimated Value
Purchase Details
Closed on
Sep 3, 2010
Sold by
Pittman Nicholas J and Pittman Lynda M
Bought by
Scott Douglas and Scott Angela
Home Financials for this Owner
Home Financials are based on the most recent Mortgage that was taken out on this home.
Original Mortgage
$16,975
Interest Rate
4.54%
Mortgage Type
Seller Take Back
Purchase Details
Closed on
Apr 7, 2005
Sold by
Sovereign Bank
Bought by
Pittman Nicholas J
Purchase Details
Closed on
Dec 29, 2004
Sold by
Isaacs Jerry C and Isaacs Laurie D
Bought by
Sovereign Bank
Purchase Details
Closed on
Jun 4, 1997
Sold by
Est Somers Knierim
Bought by
Isaacs Jerry and Isaacs Laurie
Purchase Details
Closed on
Nov 1, 1972
Bought by
Knierim Somers K
Create a Home Valuation Report for This Property
The Home Valuation Report is an in-depth analysis detailing your home's value as well as a comparison with similar homes in the area
Purchase History
| Date | Buyer | Sale Price | Title Company |
|---|---|---|---|
| Pittman Nicholas J | -- | Attorney | |
| Scott Douglas | $17,100 | Attorney | |
| Pittman Nicholas J | $10,000 | Sovereign Title Agency Llc | |
| Sovereign Bank | $8,000 | None Available | |
| Isaacs Jerry | $8,000 | -- | |
| Knierim Somers K | $5,000 | -- |
Source: Public Records
Mortgage History
| Date | Status | Borrower | Loan Amount |
|---|---|---|---|
| Previous Owner | Scott Douglas | $16,975 |
Source: Public Records
Tax History
| Year | Tax Paid | Tax Assessment Tax Assessment Total Assessment is a certain percentage of the fair market value that is determined by local assessors to be the total taxable value of land and additions on the property. | Land | Improvement |
|---|---|---|---|---|
| 2024 | $348 | $7,990 | $810 | $7,180 |
| 2023 | $372 | $7,600 | $770 | $6,830 |
| 2022 | $372 | $7,600 | $770 | $6,830 |
| 2021 | $392 | $7,600 | $770 | $6,830 |
| 2020 | $407 | $7,070 | $770 | $6,300 |
| 2019 | $407 | $7,070 | $770 | $6,300 |
| 2018 | $431 | $7,070 | $770 | $6,300 |
| 2017 | $408 | $7,070 | $770 | $6,300 |
| 2016 | $415 | $7,070 | $770 | $6,300 |
| 2015 | $494 | $7,070 | $770 | $6,300 |
| 2014 | $494 | $8,580 | $810 | $7,770 |
| 2013 | $533 | $8,580 | $810 | $7,770 |
Source: Public Records
Map
Nearby Homes
- 610 Linden St
- 817 E Eureka St
- 145 S Pine St
- 806 Bellefontaine Ave
- 129 S Pine St
- 520 Orena Ave
- 629 Harrison Ave
- 546 Orena Ave
- 653 S Scott St
- 621 Prospect Ave
- 617 E Kibby St
- 717 E Kibby St
- 504 S Shawnee St
- 706 E Kibby St
- 717 E Albert St
- 00 E Albert St
- 544 S Pine St
- 1210 E Market St
- 650 S Dewey Ave
- 00 Bellefontaine Ave
Your Personal Tour Guide
Ask me questions while you tour the home.