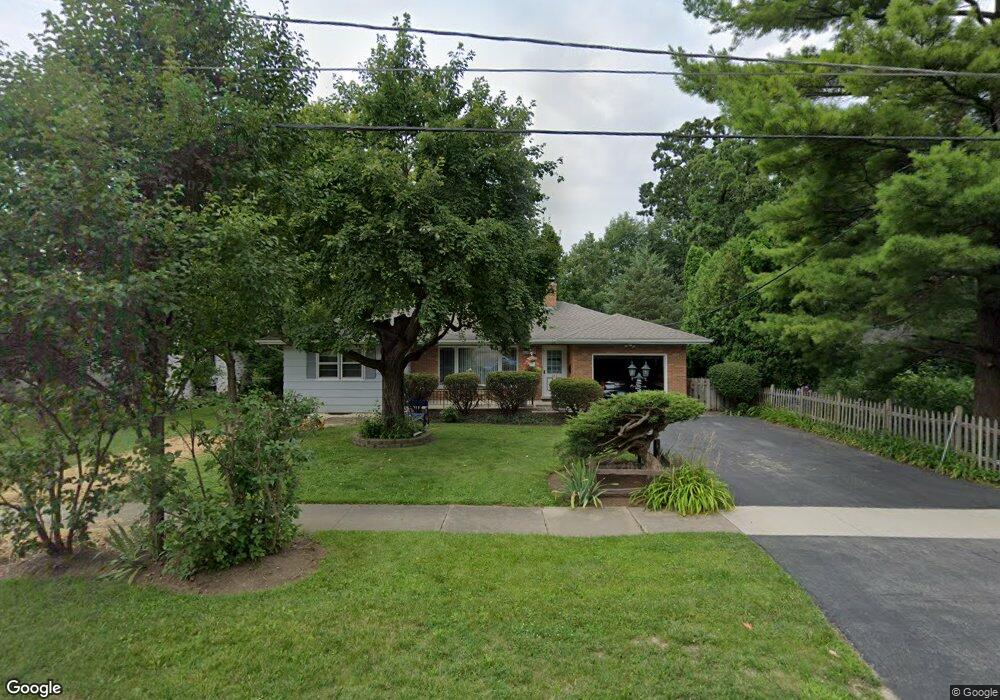
226 S Seymour Ave Grayslake, IL 60030
Estimated Value: $275,621 - $344,000
--
Bed
2
Baths
1,556
Sq Ft
$201/Sq Ft
Est. Value
About This Home
This home is located at 226 S Seymour Ave, Grayslake, IL 60030 and is currently estimated at $313,405, approximately $201 per square foot. 226 S Seymour Ave is a home located in Lake County with nearby schools including Woodview School, Frederick School, and Grayslake Middle School.
Ownership History
Date
Name
Owned For
Owner Type
Purchase Details
Closed on
Mar 2, 2005
Sold by
Meyer Mary C
Bought by
Meyer William J
Current Estimated Value
Home Financials for this Owner
Home Financials are based on the most recent Mortgage that was taken out on this home.
Original Mortgage
$146,600
Outstanding Balance
$74,765
Interest Rate
5.7%
Mortgage Type
New Conventional
Estimated Equity
$238,640
Purchase Details
Closed on
Feb 15, 1994
Sold by
Smith Robert and Smith Dorothy
Bought by
Meyer William J and Meyer Mary C
Home Financials for this Owner
Home Financials are based on the most recent Mortgage that was taken out on this home.
Original Mortgage
$108,000
Interest Rate
7.32%
Mortgage Type
Seller Take Back
Purchase Details
Closed on
Feb 11, 1994
Sold by
Paddock Cheryl S
Bought by
Smith Robert and Smith Dorothy
Home Financials for this Owner
Home Financials are based on the most recent Mortgage that was taken out on this home.
Original Mortgage
$108,000
Interest Rate
7.32%
Mortgage Type
Seller Take Back
Create a Home Valuation Report for This Property
The Home Valuation Report is an in-depth analysis detailing your home's value as well as a comparison with similar homes in the area
Home Values in the Area
Average Home Value in this Area
Purchase History
| Date | Buyer | Sale Price | Title Company |
|---|---|---|---|
| Meyer William J | -- | -- | |
| Meyer William J | $80,000 | Intercounty Title Company | |
| Smith Robert | $8,666 | Intercounty Title Company |
Source: Public Records
Mortgage History
| Date | Status | Borrower | Loan Amount |
|---|---|---|---|
| Open | Meyer William J | $146,600 | |
| Closed | Meyer William J | $108,000 |
Source: Public Records
Tax History Compared to Growth
Tax History
| Year | Tax Paid | Tax Assessment Tax Assessment Total Assessment is a certain percentage of the fair market value that is determined by local assessors to be the total taxable value of land and additions on the property. | Land | Improvement |
|---|---|---|---|---|
| 2024 | $3,950 | $74,335 | $21,741 | $52,594 |
| 2023 | $4,627 | $68,222 | $19,953 | $48,269 |
| 2022 | $4,627 | $67,583 | $8,256 | $59,327 |
| 2021 | $4,771 | $64,958 | $7,935 | $57,023 |
| 2020 | $5,031 | $61,806 | $7,550 | $54,256 |
| 2019 | $5,007 | $59,298 | $7,244 | $52,054 |
| 2018 | $5,214 | $62,490 | $19,124 | $43,366 |
| 2017 | $5,358 | $58,781 | $17,989 | $40,792 |
| 2016 | $5,608 | $54,261 | $16,606 | $37,655 |
| 2015 | $6,811 | $49,572 | $15,171 | $34,401 |
| 2014 | $6,314 | $46,119 | $12,952 | $33,167 |
| 2012 | $6,239 | $48,166 | $13,527 | $34,639 |
Source: Public Records
Map
Nearby Homes
- 146 Westerfield Place
- 121 Park Ave
- 10 Glen St
- 349 Brittain Ave
- 11 S Lake St
- 390 N Garfield Blvd
- 101 Burton St
- 533 Cannon Ball Dr
- 102 Soo Line Dr
- 220 Bluff Ct
- 42 Village Station Ln
- 231 Lionel Dr
- 270 Lionel Dr
- 228 Station Park Cir
- 34110 S Circle Dr
- Lot 48 Lake Ave
- 32100 Alleghany Rd
- 337 Woodland Dr Unit 6
- 418 Flanders Ln
- 566 Chard Ct
- 232 S Seymour Ave
- 238 S Seymour Ave
- 251 Junior Ave
- 231 Junior Ave
- 227 Harding St
- 221 Junior Ave
- 235 Harding St
- 250 S Seymour Ave
- 195 S Seymour Ave
- 231 S Seymour Ave
- 243 Harding St
- 191 S Seymour Ave
- 237 S Seymour Ave
- 187 S Seymour Ave
- 243 S Seymour Ave
- 249 Harding St
- 183 S Seymour Ave
- 257 Harding St
- 179 S Seymour Ave
- 249 S Seymour Ave