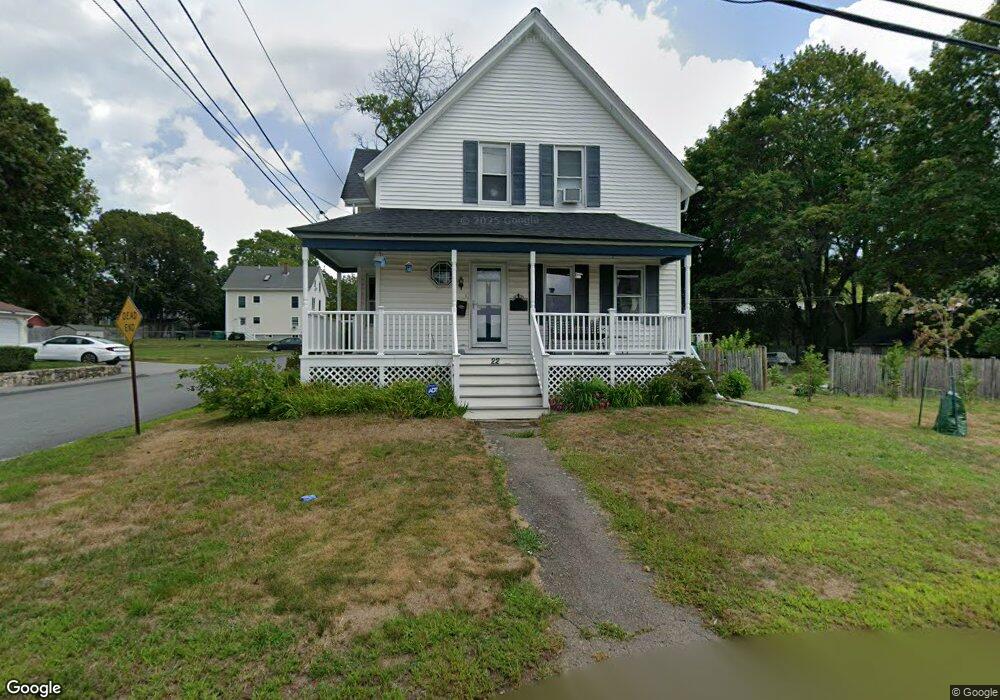
226 Smith St North Attleboro, MA 02760
North Attleboro NeighborhoodEstimated Value: $442,174 - $500,000
4
Beds
1
Bath
1,323
Sq Ft
$355/Sq Ft
Est. Value
About This Home
This home is located at 226 Smith St, North Attleboro, MA 02760 and is currently estimated at $470,294, approximately $355 per square foot. 226 Smith St is a home located in Bristol County with nearby schools including North Attleboro High School and Cadence Academy Preschool - North Attleborough.
Ownership History
Date
Name
Owned For
Owner Type
Purchase Details
Closed on
Jul 6, 2018
Sold by
Dirschel Mark and Dirschel Patricia
Bought by
Dirschel Patricia
Current Estimated Value
Purchase Details
Closed on
Aug 9, 2000
Sold by
Delfino Brian C
Bought by
Dirschel Mark and Dirschel Patricia
Purchase Details
Closed on
Aug 26, 1994
Sold by
Usa Va
Bought by
Delfino Brian C
Purchase Details
Closed on
Mar 11, 1994
Sold by
Carnes Joseph J
Bought by
Usa
Create a Home Valuation Report for This Property
The Home Valuation Report is an in-depth analysis detailing your home's value as well as a comparison with similar homes in the area
Home Values in the Area
Average Home Value in this Area
Purchase History
| Date | Buyer | Sale Price | Title Company |
|---|---|---|---|
| Dirschel Patricia | -- | -- | |
| Dirschel Mark | $179,900 | -- | |
| Delfino Brian C | $126,307 | -- | |
| Usa | $101,155 | -- |
Source: Public Records
Mortgage History
| Date | Status | Borrower | Loan Amount |
|---|---|---|---|
| Previous Owner | Usa | $255,392 | |
| Previous Owner | Usa | $188,000 | |
| Previous Owner | Usa | $17,000 |
Source: Public Records
Tax History Compared to Growth
Tax History
| Year | Tax Paid | Tax Assessment Tax Assessment Total Assessment is a certain percentage of the fair market value that is determined by local assessors to be the total taxable value of land and additions on the property. | Land | Improvement |
|---|---|---|---|---|
| 2025 | $3,946 | $334,700 | $126,200 | $208,500 |
| 2024 | $3,799 | $329,200 | $126,200 | $203,000 |
| 2023 | $3,817 | $298,400 | $126,200 | $172,200 |
| 2022 | $3,838 | $275,500 | $126,200 | $149,300 |
| 2021 | $3,699 | $259,200 | $126,200 | $133,000 |
| 2020 | $3,674 | $256,000 | $126,200 | $129,800 |
| 2019 | $3,419 | $240,100 | $114,800 | $125,300 |
| 2018 | $3,060 | $229,400 | $114,800 | $114,600 |
| 2017 | $2,890 | $218,600 | $114,800 | $103,800 |
| 2016 | $2,816 | $213,000 | $127,500 | $85,500 |
| 2015 | $2,742 | $208,700 | $133,900 | $74,800 |
| 2014 | $2,729 | $206,100 | $123,800 | $82,300 |
Source: Public Records
Map
Nearby Homes
- 633 E Washington St Unit 17
- 633 E Washington St Unit 10
- 212 Fisher St Unit A5
- 217 Fisher St
- 0 Landry 2nd Unit 73350867
- 68 Fisher St
- 8 Al Pace Dr Unit 8
- 880 Landry Ave Unit 2
- 42 2nd Ave Unit 24
- 64 Smith St
- 711 Mount Hope St Unit 7
- 711 Mount Hope St Unit 6
- 711 Mount Hope St Unit 8
- 711 Mount Hope St Unit 5
- 711 Mount Hope St Unit 12
- 711 Mount Hope St Unit 9
- 711 Mount Hope St Unit 11
- 711 Mount Hope St Unit 10
- 711 Mount Hope St Unit 16
- 711 Mount Hope St Unit 15
- 11 Columbia St
- 220 Smith St
- 231 Smith St
- 231 Smith St Unit 231
- 231 Smith St Unit 1
- 233 Smith St Unit 2
- 233 Smith St Unit 233
- 18 Columbia St Unit 20
- 18 Columbia St Unit 1
- 21 Columbia St
- 216 Smith St
- 227 Smith St
- 153 Fisher St
- 210 Smith St
- 208 Smith St
- 157 Fisher St
- 27 Columbia St
- 211 Smith St
- 165 Fisher St
- 171 Fisher St