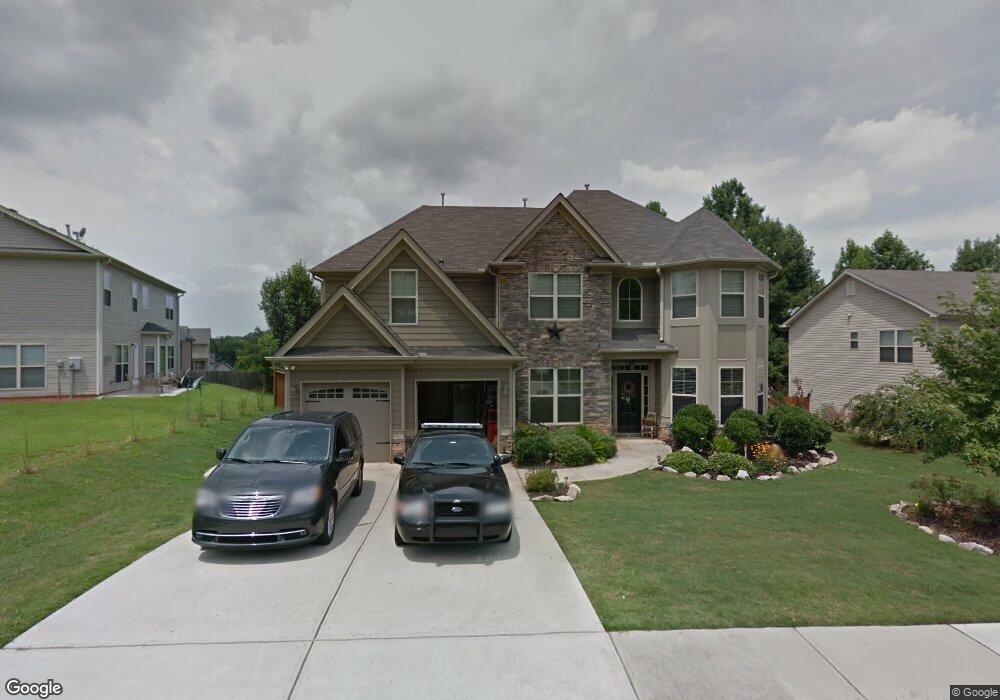
226 Spinner Dr Jefferson, GA 30549
Estimated Value: $432,000 - $505,000
5
Beds
3
Baths
3,049
Sq Ft
$153/Sq Ft
Est. Value
About This Home
This home is located at 226 Spinner Dr, Jefferson, GA 30549 and is currently estimated at $467,963, approximately $153 per square foot. 226 Spinner Dr is a home located in Jackson County with nearby schools including Jefferson Elementary School, Jefferson Academy, and Jefferson Middle School.
Ownership History
Date
Name
Owned For
Owner Type
Purchase Details
Closed on
Nov 1, 2007
Sold by
Not Provided
Bought by
Ann Hoffman Donald Leroy and Ann Traci
Current Estimated Value
Home Financials for this Owner
Home Financials are based on the most recent Mortgage that was taken out on this home.
Original Mortgage
$244,900
Outstanding Balance
$150,420
Interest Rate
6.26%
Mortgage Type
New Conventional
Estimated Equity
$317,543
Purchase Details
Closed on
Dec 20, 2004
Sold by
Bryan Mill Partners Llc
Bought by
Bryan Mill Builders Llc
Create a Home Valuation Report for This Property
The Home Valuation Report is an in-depth analysis detailing your home's value as well as a comparison with similar homes in the area
Home Values in the Area
Average Home Value in this Area
Purchase History
| Date | Buyer | Sale Price | Title Company |
|---|---|---|---|
| Ann Hoffman Donald Leroy | $244,900 | -- | |
| Bryan Mill Builders Llc | $140,000 | -- |
Source: Public Records
Mortgage History
| Date | Status | Borrower | Loan Amount |
|---|---|---|---|
| Open | Ann Hoffman Donald Leroy | $244,900 |
Source: Public Records
Tax History
| Year | Tax Paid | Tax Assessment Tax Assessment Total Assessment is a certain percentage of the fair market value that is determined by local assessors to be the total taxable value of land and additions on the property. | Land | Improvement |
|---|---|---|---|---|
| 2025 | $5,045 | $184,280 | $24,000 | $160,280 |
| 2024 | $5,045 | $184,280 | $24,000 | $160,280 |
| 2023 | $5,065 | $166,840 | $24,000 | $142,840 |
| 2022 | $4,464 | $139,440 | $24,000 | $115,440 |
| 2021 | $4,178 | $128,240 | $12,800 | $115,440 |
| 2020 | $3,686 | $105,800 | $12,800 | $93,000 |
| 2019 | $3,741 | $105,800 | $12,800 | $93,000 |
| 2018 | $3,608 | $101,280 | $12,800 | $88,480 |
| 2017 | $3,212 | $88,424 | $12,800 | $75,624 |
| 2016 | $3,154 | $86,424 | $10,800 | $75,624 |
| 2015 | $3,166 | $86,424 | $10,800 | $75,624 |
| 2014 | $2,610 | $70,652 | $10,800 | $59,852 |
| 2013 | -- | $66,162 | $10,800 | $55,362 |
Source: Public Records
Map
Nearby Homes
- 221 Spinner Dr
- 53 Bobbin Ct
- 0 Brockton Loop Rd Unit Lot 1 and 2
- 0 Brockton Loop Rd
- 205 Chariot Ct
- 174 Chariot Ct
- 165 Chariot Ct
- 0 Long Leaf Dr Unit 7665497
- 0 Long Leaf Dr Unit 7665504
- 0 Long Leaf Dr Unit LOT 25
- 0 Long Leaf Dr Unit LOT 15
- 0 Long Leaf Dr Unit LOT 27
- 0 Long Leaf Dr Unit 7665559
- 0 Long Leaf Dr Unit LOT 28
- 0 Long Leaf Dr Unit 7665526
- 137 Duke St
- 114 Duke St
- 75 Ashebrooke Way
- 0 Panther Dr Unit 7708361
- 0 Panther Dr Unit 10677593
Your Personal Tour Guide
Ask me questions while you tour the home.