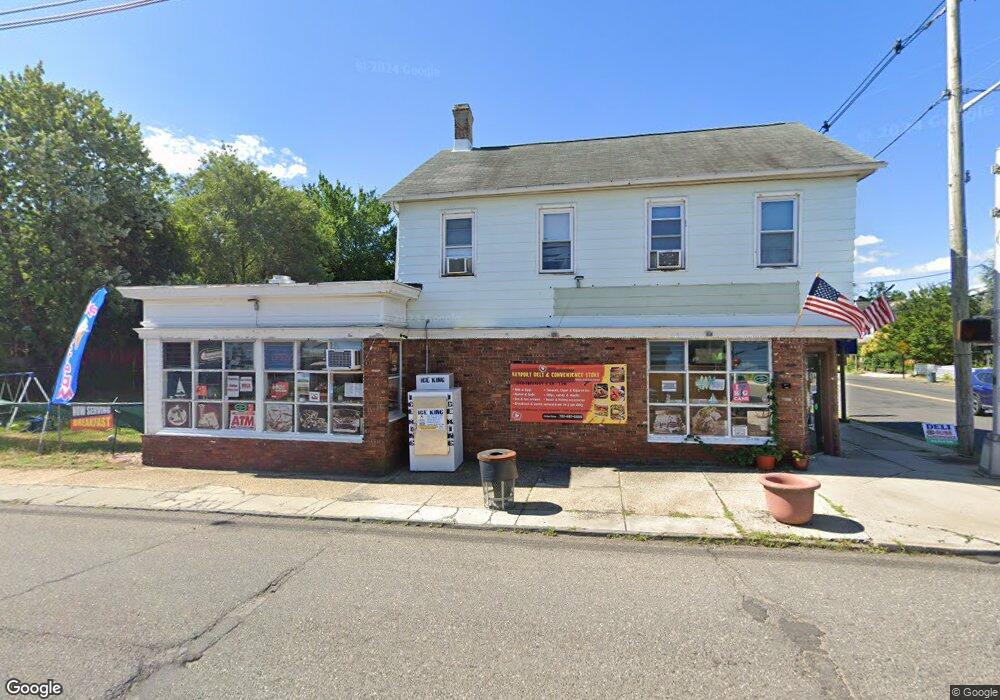
226 W Front St Keyport, NJ 07735
--
Bed
--
Bath
1,600
Sq Ft
2.25
Acres
About This Home
This home is located at 226 W Front St, Keyport, NJ 07735. 226 W Front St is a home located in Monmouth County with nearby schools including Keyport Central School, Keyport High School, and Icob Academy.
Ownership History
Date
Name
Owned For
Owner Type
Purchase Details
Closed on
Dec 11, 2018
Sold by
Modi Alok D
Bought by
Keyport Plaza Llc
Home Financials for this Owner
Home Financials are based on the most recent Mortgage that was taken out on this home.
Original Mortgage
$272,000
Interest Rate
4.5%
Mortgage Type
Commercial
Purchase Details
Closed on
Dec 24, 2015
Sold by
Shree Bala Corp
Bought by
Modi Alok D
Purchase Details
Closed on
Oct 17, 2002
Sold by
Mata Bhramani Inc
Bought by
Shree Bala Corp
Home Financials for this Owner
Home Financials are based on the most recent Mortgage that was taken out on this home.
Original Mortgage
$221,000
Interest Rate
6.17%
Mortgage Type
Commercial
Purchase Details
Closed on
Aug 17, 2001
Sold by
Richards Delicatessen Inc
Bought by
Mata Bhramani Inc
Home Financials for this Owner
Home Financials are based on the most recent Mortgage that was taken out on this home.
Original Mortgage
$140,000
Interest Rate
6.6%
Mortgage Type
Commercial
Create a Home Valuation Report for This Property
The Home Valuation Report is an in-depth analysis detailing your home's value as well as a comparison with similar homes in the area
Home Values in the Area
Average Home Value in this Area
Purchase History
| Date | Buyer | Sale Price | Title Company |
|---|---|---|---|
| Keyport Plaza Llc | $399,000 | Chicago Title Insurance Co | |
| Modi Alok D | $157,000 | None Available | |
| Shree Bala Corp | $250,000 | -- | |
| Mata Bhramani Inc | $114,500 | -- |
Source: Public Records
Mortgage History
| Date | Status | Borrower | Loan Amount |
|---|---|---|---|
| Previous Owner | Keyport Plaza Llc | $272,000 | |
| Previous Owner | Shree Bala Corp | $221,000 | |
| Previous Owner | Mata Bhramani Inc | $140,000 |
Source: Public Records
Tax History Compared to Growth
Tax History
| Year | Tax Paid | Tax Assessment Tax Assessment Total Assessment is a certain percentage of the fair market value that is determined by local assessors to be the total taxable value of land and additions on the property. | Land | Improvement |
|---|---|---|---|---|
| 2025 | $11,238 | $530,100 | $311,800 | $218,300 |
| 2024 | $10,133 | $526,600 | $271,100 | $255,500 |
| 2023 | $10,133 | $461,000 | $246,500 | $214,500 |
| 2022 | $10,120 | $386,500 | $214,300 | $172,200 |
| 2021 | $10,120 | $387,900 | $173,600 | $214,300 |
| 2020 | $10,438 | $397,200 | $173,600 | $223,600 |
| 2019 | $6,977 | $265,000 | $147,000 | $118,000 |
| 2018 | $7,193 | $267,900 | $149,900 | $118,000 |
| 2017 | $7,228 | $267,900 | $149,900 | $118,000 |
| 2016 | $7,113 | $267,900 | $149,900 | $118,000 |
| 2015 | $7,070 | $265,000 | $147,000 | $118,000 |
| 2014 | $6,776 | $256,100 | $151,900 | $104,200 |
Source: Public Records
Map
Nearby Homes
- 95 Broadway
- 8 Chingarora Ave
- 54 Chingarora Ave
- 127 Chingarora Ave
- 253 Broadway
- 1 Hobart St
- 52 Highway 35
- 9 Monmouth Place
- 324 Maple Place
- 55 E Front St
- 40 Church St
- 226 Osborn St
- 369 Riverdale Dr
- 910 Malden Dr
- 90 Saint Peters Place
- 22 Lower Main St
- 128 1st St
- 195 Atlantic St
- 358 Shadynook St
- 998 Woodmere Dr