Estimated Value: $233,000 - $292,000
3
Beds
2
Baths
1,793
Sq Ft
$152/Sq Ft
Est. Value
About This Home
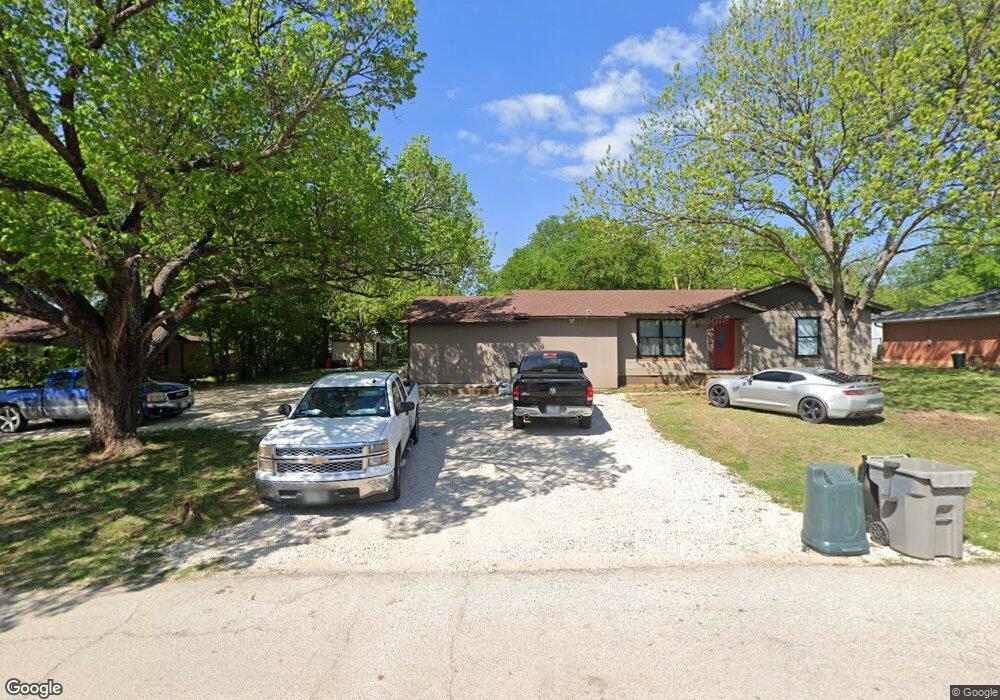
This home is located at 226 W Jones St, Krum, TX 76249 and is currently estimated at $272,421, approximately $151 per square foot. 226 W Jones St is a home located in Denton County with nearby schools including Krum Early Education Center, Dyer Elementary School, and Krum Middle School.
Ownership History
Date
Name
Owned For
Owner Type
Purchase Details
Closed on
Dec 21, 2021
Sold by
Davenport Investment Group Llc
Bought by
Rangel Alberto Rodriguez and Salazar Carla V
Current Estimated Value
Home Financials for this Owner
Home Financials are based on the most recent Mortgage that was taken out on this home.
Original Mortgage
$237,900
Outstanding Balance
$218,835
Interest Rate
3.12%
Mortgage Type
Seller Take Back
Estimated Equity
$53,586
Purchase Details
Closed on
May 19, 2021
Sold by
Bowery James Wayne and Estate Of James Wayne Bowery
Bought by
Davenport Investment Group Llc
Create a Home Valuation Report for This Property
The Home Valuation Report is an in-depth analysis detailing your home's value as well as a comparison with similar homes in the area
Home Values in the Area
Average Home Value in this Area
Purchase History
| Date | Buyer | Sale Price | Title Company |
|---|---|---|---|
| Rangel Alberto Rodriguez | -- | Hausheer Law Pllc | |
| Davenport Investment Group Llc | -- | None Listed On Document |
Source: Public Records
Mortgage History
| Date | Status | Borrower | Loan Amount |
|---|---|---|---|
| Open | Rangel Alberto Rodriguez | $237,900 |
Source: Public Records
Tax History Compared to Growth
Tax History
| Year | Tax Paid | Tax Assessment Tax Assessment Total Assessment is a certain percentage of the fair market value that is determined by local assessors to be the total taxable value of land and additions on the property. | Land | Improvement |
|---|---|---|---|---|
| 2025 | $5,999 | $227,325 | $73,500 | $153,825 |
| 2024 | $5,999 | $297,674 | $73,500 | $224,174 |
| 2023 | $5,194 | $257,246 | $73,500 | $183,746 |
| 2022 | $5,730 | $249,787 | $55,650 | $194,137 |
| 2021 | $2,940 | $132,568 | $44,100 | $88,468 |
| 2020 | $2,917 | $128,828 | $44,100 | $84,728 |
| 2019 | $3,084 | $127,823 | $44,100 | $83,723 |
| 2018 | $2,401 | $99,000 | $44,100 | $54,900 |
| 2017 | $2,308 | $94,756 | $33,600 | $61,156 |
| 2016 | $2,298 | $83,551 | $33,600 | $49,951 |
| 2015 | $1,921 | $82,500 | $33,600 | $48,900 |
| 2013 | -- | $71,621 | $33,600 | $38,021 |
Source: Public Records
Map
Nearby Homes