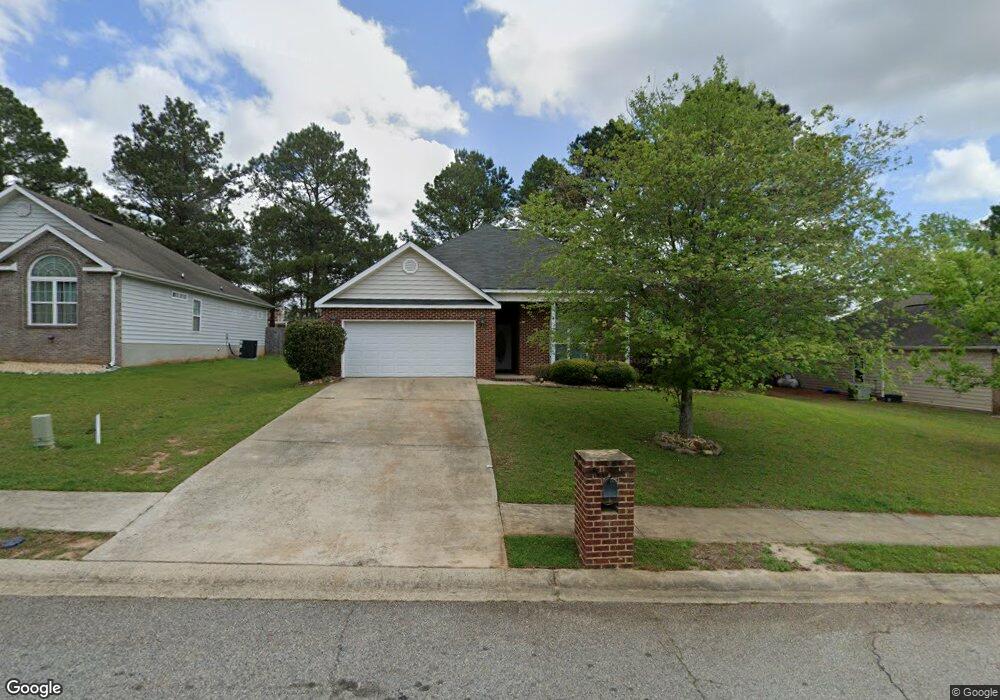
226 Wingfield Way Kathleen, GA 31047
Estimated Value: $241,000 - $274,000
4
Beds
2
Baths
1,586
Sq Ft
$163/Sq Ft
Est. Value
About This Home
This home is located at 226 Wingfield Way, Kathleen, GA 31047 and is currently estimated at $258,334, approximately $162 per square foot. 226 Wingfield Way is a home located in Houston County with nearby schools including Matthew Arthur Elementary School, Perry Middle School, and Veterans High School.
Ownership History
Date
Name
Owned For
Owner Type
Purchase Details
Closed on
Feb 29, 2024
Sold by
Johnson Tyler
Bought by
Nyhaug-Heinonen Tory and Miller Savannah
Current Estimated Value
Home Financials for this Owner
Home Financials are based on the most recent Mortgage that was taken out on this home.
Original Mortgage
$194,500
Outstanding Balance
$191,301
Interest Rate
6.69%
Mortgage Type
New Conventional
Estimated Equity
$67,033
Purchase Details
Closed on
Jun 17, 2019
Sold by
Raley Michael C and Raley Kirsten A
Bought by
Johnson Tyler
Home Financials for this Owner
Home Financials are based on the most recent Mortgage that was taken out on this home.
Original Mortgage
$168,547
Interest Rate
4.1%
Mortgage Type
VA
Purchase Details
Closed on
Sep 9, 2005
Sold by
Raley Michael C
Bought by
Raley Michael C and Raley Kristen A
Purchase Details
Closed on
Sep 7, 2005
Sold by
Vasile Properties Inc
Bought by
Raley Michael C
Purchase Details
Closed on
Sep 21, 2004
Sold by
Irnoworks Llc
Bought by
Vasile Properties Inc
Create a Home Valuation Report for This Property
The Home Valuation Report is an in-depth analysis detailing your home's value as well as a comparison with similar homes in the area
Home Values in the Area
Average Home Value in this Area
Purchase History
| Date | Buyer | Sale Price | Title Company |
|---|---|---|---|
| Nyhaug-Heinonen Tory | $260,000 | None Listed On Document | |
| Johnson Tyler | $165,000 | None Available | |
| Raley Michael C | -- | -- | |
| Raley Michael C | $136,200 | -- | |
| Vasile Properties Inc | $21,000 | -- |
Source: Public Records
Mortgage History
| Date | Status | Borrower | Loan Amount |
|---|---|---|---|
| Open | Nyhaug-Heinonen Tory | $194,500 | |
| Previous Owner | Johnson Tyler | $168,547 |
Source: Public Records
Tax History Compared to Growth
Tax History
| Year | Tax Paid | Tax Assessment Tax Assessment Total Assessment is a certain percentage of the fair market value that is determined by local assessors to be the total taxable value of land and additions on the property. | Land | Improvement |
|---|---|---|---|---|
| 2024 | $3,308 | $90,040 | $12,000 | $78,040 |
| 2023 | $2,803 | $75,760 | $12,000 | $63,760 |
| 2022 | $1,607 | $69,880 | $12,000 | $57,880 |
| 2021 | $1,483 | $64,160 | $12,000 | $52,160 |
| 2020 | $1,468 | $63,200 | $12,000 | $51,200 |
| 2019 | $0 | $54,360 | $12,000 | $42,360 |
| 2018 | $1,263 | $54,360 | $12,000 | $42,360 |
| 2017 | $1,264 | $54,360 | $12,000 | $42,360 |
| 2016 | $1,266 | $54,360 | $12,000 | $42,360 |
| 2015 | $1,269 | $54,360 | $12,000 | $42,360 |
| 2014 | -- | $54,360 | $12,000 | $42,360 |
| 2013 | -- | $54,360 | $12,000 | $42,360 |
Source: Public Records
Map
Nearby Homes
- 414 Newport Ave
- 438 Newport Ave
- 108 Bella Ct
- 207 Amberley Ct
- 203 Amberley Ct Unit 105
- 203 Amberley Ct
- 106 Lila Kate Ct
- 123 Amberley Ct
- 416 Red Hawk Pointe
- 106 Krider Ct
- 126 Hawk's Nest Dr
- 701 Amberley Ct
- 231 Black Hawke Ln
- 192 Talton Rd
- 162 Talton Rd
- 105 Grey Hawk Ct
- 160 Talton Rd
- Atlanta Plan at Planter's Ridge - Fields Two-Story
- Grayson Plan at Planter's Ridge - The Acres
- 224 Wingfield Way
- 222 Wingfield Way
- 110 Taylor Leigh Ct Unit 89
- 230 Wingfield Way
- 225 Wingfield Way
- 227 Wingfield Way
- 108 Taylor Leigh Ct
- 108 Taylor Leigh Ct Unit 90
- 105 Kaylin Ct Unit 71
- 220 Wingfield Way
- 223 Wingfield Way
- 111 Taylor Leigh Ct Unit 88
- 229 Wingfield Way
- 104 Kaylin Ct Unit 72
- 221 Wingfield Way
- 106 Taylor Leigh Ct Unit 91
- 232 Wingfield Way
- 218 Wingfield Way
- 109 Taylor Leigh Ct
- 109 Taylor Leigh Ct Unit 87