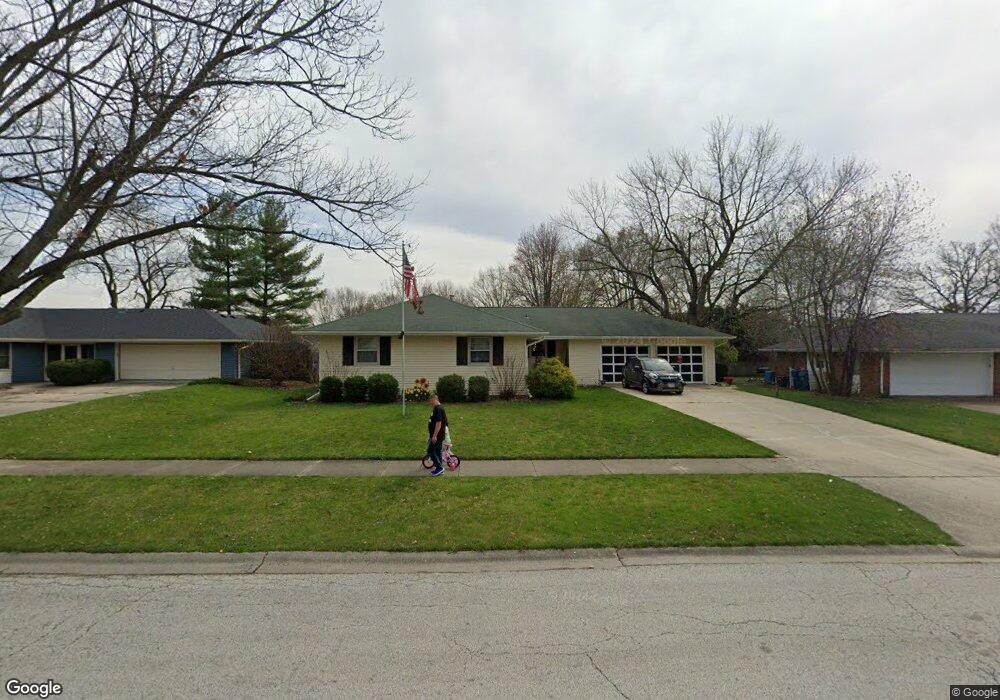
2260 Copley St Aurora, IL 60506
Edgelawn Randall NeighborhoodEstimated Value: $314,000 - $335,000
3
Beds
3
Baths
1,500
Sq Ft
$215/Sq Ft
Est. Value
About This Home
This home is located at 2260 Copley St, Aurora, IL 60506 and is currently estimated at $323,200, approximately $215 per square foot. 2260 Copley St is a home located in Kane County with nearby schools including Hall Elementary School, Jefferson Middle School, and West Aurora High School.
Ownership History
Date
Name
Owned For
Owner Type
Purchase Details
Closed on
May 29, 2009
Sold by
Cornils Richard D and Cornils Judith P
Bought by
Bogdahn David G and Bogdahn Suzanne J Campbell
Current Estimated Value
Home Financials for this Owner
Home Financials are based on the most recent Mortgage that was taken out on this home.
Original Mortgage
$191,958
Outstanding Balance
$121,674
Interest Rate
4.83%
Mortgage Type
FHA
Estimated Equity
$201,526
Purchase Details
Closed on
May 25, 2005
Sold by
Lewis James and Lewis Elizabeth
Bought by
Cornils Richard D and Cornils Judith P
Home Financials for this Owner
Home Financials are based on the most recent Mortgage that was taken out on this home.
Original Mortgage
$156,000
Interest Rate
5.91%
Mortgage Type
Fannie Mae Freddie Mac
Purchase Details
Closed on
Jun 11, 1999
Sold by
Reynolds Robert H and Reynolds Mary Ann
Bought by
Lewis James and Lewis Elizabeth
Home Financials for this Owner
Home Financials are based on the most recent Mortgage that was taken out on this home.
Original Mortgage
$136,043
Interest Rate
7.15%
Mortgage Type
FHA
Create a Home Valuation Report for This Property
The Home Valuation Report is an in-depth analysis detailing your home's value as well as a comparison with similar homes in the area
Home Values in the Area
Average Home Value in this Area
Purchase History
| Date | Buyer | Sale Price | Title Company |
|---|---|---|---|
| Bogdahn David G | $195,500 | Ticor Title Insurance Co | |
| Cornils Richard D | $195,000 | Chicago Title Insurance Comp | |
| Lewis James | $137,000 | First American Title Ins Co |
Source: Public Records
Mortgage History
| Date | Status | Borrower | Loan Amount |
|---|---|---|---|
| Open | Bogdahn David G | $191,958 | |
| Previous Owner | Cornils Richard D | $156,000 | |
| Previous Owner | Lewis James | $136,043 |
Source: Public Records
Tax History
| Year | Tax Paid | Tax Assessment Tax Assessment Total Assessment is a certain percentage of the fair market value that is determined by local assessors to be the total taxable value of land and additions on the property. | Land | Improvement |
|---|---|---|---|---|
| 2024 | $6,605 | $91,423 | $15,912 | $75,511 |
| 2023 | $6,312 | $81,686 | $14,217 | $67,469 |
| 2022 | $6,066 | $74,531 | $12,972 | $61,559 |
| 2021 | $5,791 | $69,389 | $12,077 | $57,312 |
| 2020 | $5,472 | $64,452 | $11,218 | $53,234 |
| 2019 | $5,159 | $58,757 | $10,394 | $48,363 |
| 2018 | $4,710 | $53,184 | $9,614 | $43,570 |
| 2017 | $4,976 | $54,354 | $8,858 | $45,496 |
| 2016 | $4,420 | $47,610 | $7,593 | $40,017 |
| 2015 | -- | $41,476 | $6,529 | $34,947 |
| 2014 | -- | $38,547 | $7,326 | $31,221 |
| 2013 | -- | $37,634 | $5,674 | $31,960 |
Source: Public Records
Map
Nearby Homes
- 2220 Mayflower St
- 2487 Worthington Dr
- 2472 Fox Dr
- 873 Shady Ln
- 1734 Rosedale Ct
- 220 N Rosedale Ave
- 1730 W Galena Blvd Unit 402E
- 123 N Rosedale Ave
- 1071 Almond Dr
- 106 Hillwood Place Unit 5A
- 2416 Courtyard Cir Unit 2
- 115 N Western Ave
- 170 Alschuler Dr
- 1126 Village Center Pkwy Unit 6
- 113 S Westlawn Ave
- 378 Cottrell Ln
- 375 S Constitution Dr
- 1930 Sapphire Ln
- 2972 Trillium Ct E
- 381 S Constitution Dr
- 2250 Copley St
- 2270 Copley St
- 2267 Lowell St
- 2277 Lowell St Unit 1
- 2259 Lowell St
- 2280 Copley St
- 2285 Lowell St
- 2259 Copley St
- 350 N Constitution Dr
- 2240 Copley St Unit 1
- 2269 Copley St Unit 1
- 2251 Copley St
- 2279 Copley St
- 2293 Lowell St
- 2289 Copley St
- 2231 Copley St
- 2301 Lowell St
- 2266 Lowell St
- 2250 Mayflower St
- 2260 Mayflower Dr
Your Personal Tour Guide
Ask me questions while you tour the home.