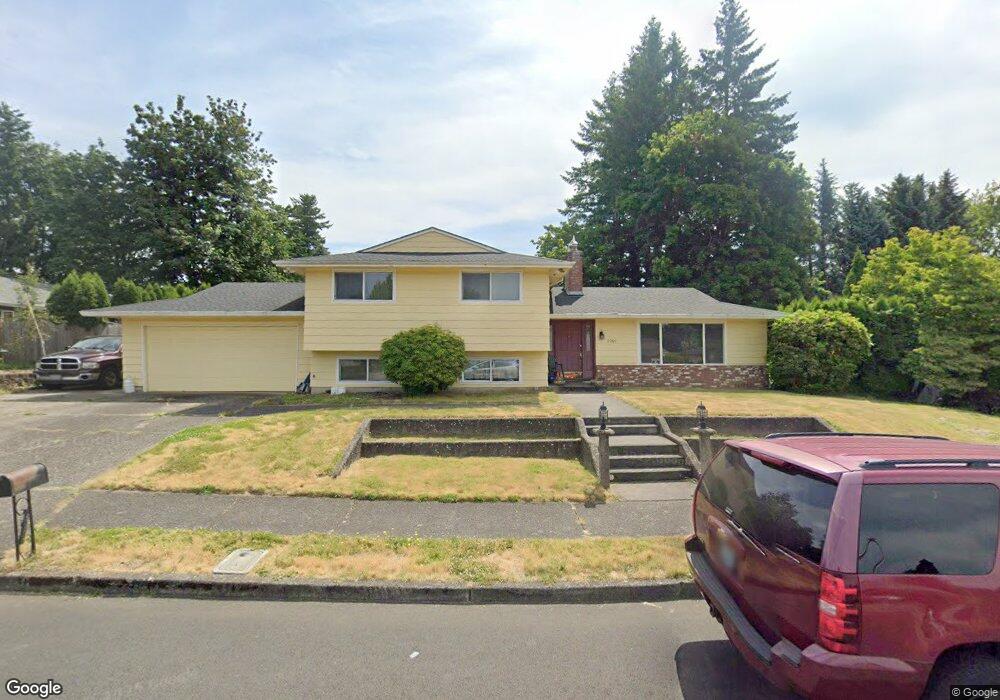
2260 NE View Ct Gresham, OR 97030
Northeast Gresham NeighborhoodEstimated Value: $499,712 - $528,000
4
Beds
3
Baths
1,440
Sq Ft
$356/Sq Ft
Est. Value
About This Home
This home is located at 2260 NE View Ct, Gresham, OR 97030 and is currently estimated at $512,678, approximately $356 per square foot. 2260 NE View Ct is a home located in Multnomah County with nearby schools including Hall Elementary School, Gordon Russell Middle School, and Sam Barlow High School.
Ownership History
Date
Name
Owned For
Owner Type
Purchase Details
Closed on
Aug 2, 2010
Sold by
Gonzalez Diaz Jose G
Bought by
Gonzalez Diaz Jose G and Gonzalez Cynthia Ann
Current Estimated Value
Home Financials for this Owner
Home Financials are based on the most recent Mortgage that was taken out on this home.
Original Mortgage
$155,000
Interest Rate
4.65%
Mortgage Type
New Conventional
Purchase Details
Closed on
May 4, 2001
Sold by
Hebb James M
Bought by
Gonzalez Jose G and Gonzalez Cindy
Home Financials for this Owner
Home Financials are based on the most recent Mortgage that was taken out on this home.
Original Mortgage
$182,800
Interest Rate
6.89%
Mortgage Type
Purchase Money Mortgage
Purchase Details
Closed on
Sep 23, 1999
Sold by
Kambeitz Martin J
Bought by
Gonzalez Jose G and Gonzalez Cindy
Home Financials for this Owner
Home Financials are based on the most recent Mortgage that was taken out on this home.
Original Mortgage
$165,300
Interest Rate
7.97%
Mortgage Type
Purchase Money Mortgage
Create a Home Valuation Report for This Property
The Home Valuation Report is an in-depth analysis detailing your home's value as well as a comparison with similar homes in the area
Home Values in the Area
Average Home Value in this Area
Purchase History
| Date | Buyer | Sale Price | Title Company |
|---|---|---|---|
| Gonzalez Diaz Jose G | -- | Stewart Title | |
| Gonzalez Jose G | -- | Fidelity National Title Co | |
| Gonzalez Jose G | $174,000 | Oregon Title Insurance Co |
Source: Public Records
Mortgage History
| Date | Status | Borrower | Loan Amount |
|---|---|---|---|
| Closed | Gonzalez Diaz Jose G | $155,000 | |
| Closed | Gonzalez Jose G | $182,800 | |
| Previous Owner | Gonzalez Jose G | $165,300 |
Source: Public Records
Tax History
| Year | Tax Paid | Tax Assessment Tax Assessment Total Assessment is a certain percentage of the fair market value that is determined by local assessors to be the total taxable value of land and additions on the property. | Land | Improvement |
|---|---|---|---|---|
| 2025 | $5,540 | $272,220 | -- | -- |
| 2024 | $5,303 | $264,300 | -- | -- |
| 2023 | $5,303 | $256,610 | -- | -- |
| 2022 | $4,696 | $249,140 | $0 | $0 |
| 2021 | $4,578 | $241,890 | $0 | $0 |
| 2020 | $4,308 | $234,850 | $0 | $0 |
| 2019 | $4,195 | $228,010 | $0 | $0 |
| 2018 | $4,000 | $221,370 | $0 | $0 |
| 2017 | $3,837 | $214,930 | $0 | $0 |
| 2016 | $3,383 | $208,670 | $0 | $0 |
| 2015 | $3,310 | $202,600 | $0 | $0 |
| 2014 | $3,230 | $196,700 | $0 | $0 |
Source: Public Records
Map
Nearby Homes
- 1795 NE 19th St
- 1812 NE 19th St Unit 27
- 1830 NE Hogan Dr Unit 83
- 2797 NE Rene Ave Unit 25C
- 1802 NE Hogan Dr Unit 97
- 1722 NE Hogan Dr Unit 103
- 1556 NE 27th Terrace
- 2200 NE Liberty Ave
- 1508 NE Hogan Dr Unit 134
- 1418 NE Hogan Dr
- 2578 NE Morlan Ave
- 1308 NE Hogan Dr Unit 166
- 2105 NE Cleveland Ave
- 24141 SE Oak St
- 1350 NE Cochran Dr
- 3311 NE View Ave Unit 3313
- 1553 NE Hale Place Unit 1
- 3025 NE 29th St
- 1500 NE Paropa Ct Unit 1
- 3248 NE 29th St Unit 31
- 2010 NE 23rd St
- 2210 NE View Ct
- 2255 NE Francis Ct
- 2275 NE View Ct
- 2275 NE Francis Ct
- 2255 NE View Ct
- 2205 NE Francis Ct
- 1930 NE View Ct
- 3809 NE View Ct
- 3871 NE View Ct
- 1915 NE View Ct
- 2120 NE Francis Ct
- 2260 NE Francis Ct
- 2280 NE Francis Ct
- 2333 NE Francis Place
- 1910 NE View Ct
- 1900 NE 23rd St
- 1885 NE View Ct
- 2150 NE Francis Ct
- 2180 NE 23rd St
Your Personal Tour Guide
Ask me questions while you tour the home.