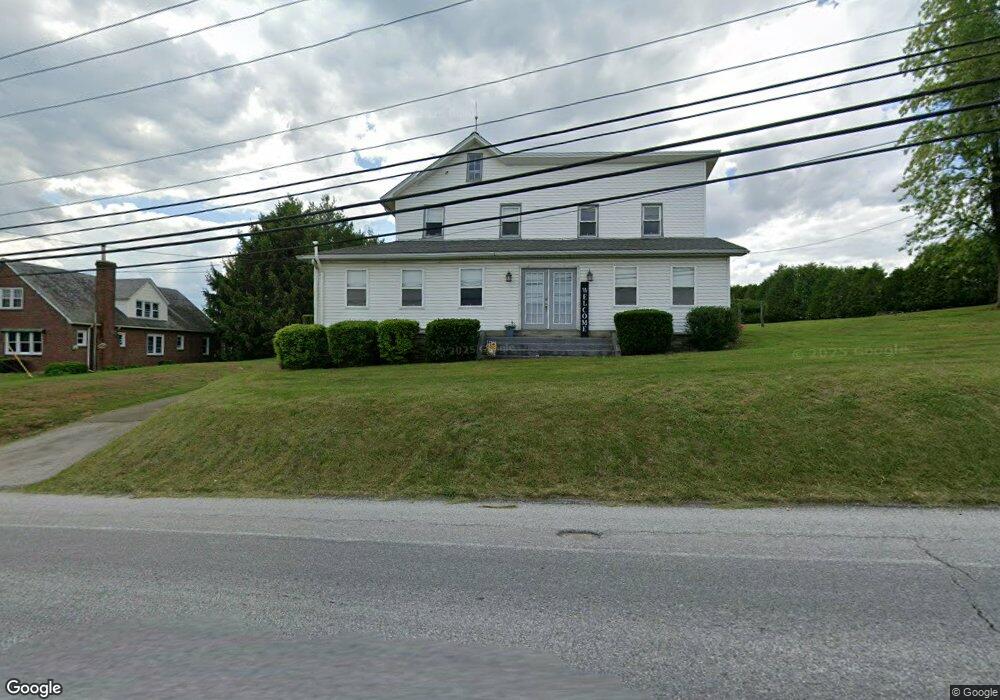
2260 Robert Fulton Hwy Peach Bottom, PA 17563
Fulton Township NeighborhoodEstimated Value: $165,000 - $690,311
--
Bed
3
Baths
4,148
Sq Ft
$94/Sq Ft
Est. Value
About This Home
This home is located at 2260 Robert Fulton Hwy, Peach Bottom, PA 17563 and is currently estimated at $388,328, approximately $93 per square foot. 2260 Robert Fulton Hwy is a home located in Lancaster County with nearby schools including Smith Middle School and Solanco High School.
Ownership History
Date
Name
Owned For
Owner Type
Purchase Details
Closed on
Oct 18, 2023
Sold by
Stoltzfus Samuel Z and Stoltzfus Bertha M
Bought by
Stoltzfus Benjamin S and Stoltzfus Sarah S
Current Estimated Value
Home Financials for this Owner
Home Financials are based on the most recent Mortgage that was taken out on this home.
Original Mortgage
$600,000
Outstanding Balance
$588,202
Interest Rate
7.12%
Mortgage Type
Credit Line Revolving
Estimated Equity
-$199,874
Purchase Details
Closed on
Mar 8, 2016
Sold by
Moran David W and Moran Corinna L
Bought by
Stoltzfus Samuel Z and Stoltzfus Bertha M
Create a Home Valuation Report for This Property
The Home Valuation Report is an in-depth analysis detailing your home's value as well as a comparison with similar homes in the area
Home Values in the Area
Average Home Value in this Area
Purchase History
| Date | Buyer | Sale Price | Title Company |
|---|---|---|---|
| Stoltzfus Benjamin S | -- | None Listed On Document | |
| Stoltzfus Samuel Z | $450,500 | None Available |
Source: Public Records
Mortgage History
| Date | Status | Borrower | Loan Amount |
|---|---|---|---|
| Open | Stoltzfus Benjamin S | $600,000 |
Source: Public Records
Tax History Compared to Growth
Tax History
| Year | Tax Paid | Tax Assessment Tax Assessment Total Assessment is a certain percentage of the fair market value that is determined by local assessors to be the total taxable value of land and additions on the property. | Land | Improvement |
|---|---|---|---|---|
| 2025 | $5,994 | $384,200 | $157,000 | $227,200 |
| 2024 | $5,994 | $384,200 | $157,000 | $227,200 |
| 2023 | $5,812 | $384,200 | $157,000 | $227,200 |
| 2022 | $5,557 | $384,200 | $157,000 | $227,200 |
| 2021 | $5,217 | $384,200 | $157,000 | $227,200 |
| 2020 | $5,217 | $384,200 | $157,000 | $227,200 |
| 2019 | $5,217 | $384,200 | $157,000 | $227,200 |
| 2018 | $1,182 | $384,200 | $157,000 | $227,200 |
| 2017 | $5,337 | $325,500 | $71,400 | $254,100 |
| 2016 | $5,336 | $325,500 | $71,400 | $254,100 |
| 2015 | $1,284 | $325,500 | $71,400 | $254,100 |
| 2014 | -- | $325,500 | $71,400 | $254,100 |
Source: Public Records
Map
Nearby Homes
- 3 Anthony Ct
- 140 Arcadia Trace
- 0 Nottingham Rd
- 154 Black Barren Rd
- 1534 Benton Hollow Rd
- 243 Little Britain Rd
- 19 Jubilee Park
- 131 Mason Dixon Rd
- 0 New Bridge Rd Unit MDCC2014434
- 125 Brer Rabbit Rd
- Lot 16 Londonderry Ln
- L 9 Londonderry Ln Unit 9
- 743 Bell Manor Rd
- 141 Nottingham Rd
- 117 Grove Rd
- 661 Pilot Town Rd
- 45 Blarney Ln
- 520 Bell Manor Rd
- 8 Weaver Meadows Rd
- 34 Arc Dr
- 2261 Robert Fulton Hwy
- 2261 Robert Fulton Hwy
- 2264 Robert Fulton Hwy
- 2266 Robert Fulton Hwy
- 2246 Robert Fulton Hwy
- 2248 Robert Fulton Hwy
- 2251 Robert Fulton Hwy
- 2250 Robert Fulton Hwy
- 2249 Robert Fulton Hwy
- 116 Warfel Rd
- 106 Warfel Rd
- 2243 Robert Fulton Hwy
- 2270 Robert Fulton Hwy
- 124 Warfel Rd
- 106 Pear Ln
- 794 Nottingham Rd
- 2240 Robert Fulton Hwy
- 2273 Robert Fulton Hwy
- 128 Warfel Rd
- 2238 Robert Fulton Hwy