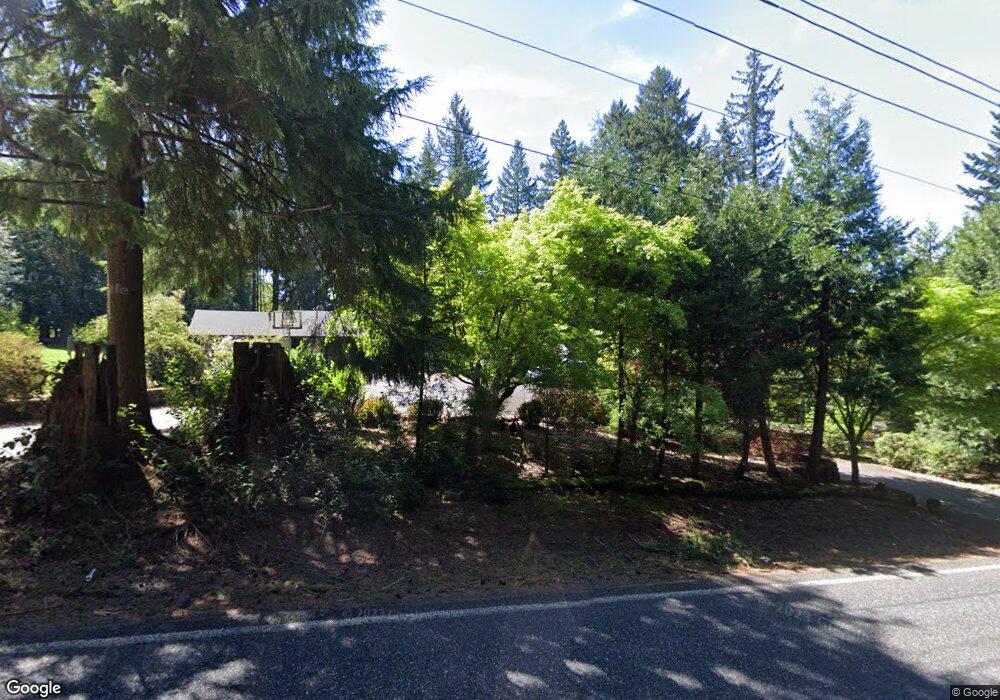
22601 NE 139th St Brush Prairie, WA 98606
Estimated Value: $886,000 - $1,219,000
3
Beds
3
Baths
3,570
Sq Ft
$288/Sq Ft
Est. Value
About This Home
This home is located at 22601 NE 139th St, Brush Prairie, WA 98606 and is currently estimated at $1,026,822, approximately $287 per square foot. 22601 NE 139th St is a home located in Clark County with nearby schools including Hockinson Middle School and Hockinson High School.
Ownership History
Date
Name
Owned For
Owner Type
Purchase Details
Closed on
Mar 11, 2005
Sold by
Markee Charles M and Markee Betty J
Bought by
Deming James L and Deming Donna L
Current Estimated Value
Home Financials for this Owner
Home Financials are based on the most recent Mortgage that was taken out on this home.
Original Mortgage
$304,000
Outstanding Balance
$106,294
Interest Rate
1%
Mortgage Type
Purchase Money Mortgage
Estimated Equity
$920,528
Purchase Details
Closed on
Jan 22, 2001
Sold by
Federal National Mortgage Association
Bought by
Markee Charles M and Markee Betty J
Home Financials for this Owner
Home Financials are based on the most recent Mortgage that was taken out on this home.
Original Mortgage
$224,200
Interest Rate
7.08%
Purchase Details
Closed on
Oct 13, 2000
Sold by
Courter Patrick D and Courter Sharron F
Bought by
Federal National Mortgage Association
Create a Home Valuation Report for This Property
The Home Valuation Report is an in-depth analysis detailing your home's value as well as a comparison with similar homes in the area
Home Values in the Area
Average Home Value in this Area
Purchase History
| Date | Buyer | Sale Price | Title Company |
|---|---|---|---|
| Deming James L | $380,000 | Stewart Title | |
| Markee Charles M | -- | Charter Title Corporation | |
| Federal National Mortgage Association | $206,025 | Cascade Title |
Source: Public Records
Mortgage History
| Date | Status | Borrower | Loan Amount |
|---|---|---|---|
| Open | Deming James L | $304,000 | |
| Previous Owner | Markee Charles M | $224,200 | |
| Closed | Deming James L | $37,500 |
Source: Public Records
Tax History Compared to Growth
Tax History
| Year | Tax Paid | Tax Assessment Tax Assessment Total Assessment is a certain percentage of the fair market value that is determined by local assessors to be the total taxable value of land and additions on the property. | Land | Improvement |
|---|---|---|---|---|
| 2025 | $9,488 | $1,084,806 | $335,301 | $749,505 |
| 2024 | $8,655 | $1,033,430 | $335,301 | $698,129 |
| 2023 | $8,893 | $1,016,090 | $326,700 | $689,390 |
| 2022 | $8,164 | $1,006,840 | $325,120 | $681,720 |
| 2021 | $7,877 | $833,014 | $281,920 | $551,094 |
| 2020 | $7,405 | $764,003 | $268,096 | $495,907 |
| 2019 | $7,041 | $706,336 | $233,536 | $472,800 |
| 2018 | $8,050 | $688,555 | $0 | $0 |
| 2017 | $7,195 | $613,877 | $0 | $0 |
| 2016 | $7,174 | $591,796 | $0 | $0 |
| 2015 | $6,918 | $541,975 | $0 | $0 |
| 2014 | -- | $523,541 | $0 | $0 |
| 2013 | -- | $476,368 | $0 | $0 |
Source: Public Records
Map
Nearby Homes
- 13610 NE 223rd Ct
- 12712 NE Shanghai Rd
- 22215 NE 128th Cir
- 23902 NE 128th St
- 12408 NE 238th Ave
- 12520 NE 246th Ct
- 22505 NE 113th St
- 13305 NE 114th Way
- 11626 NE 133rd Ct
- 20401 NE 116th Cir
- 23505 NE 105th St
- 19012 NE 139th St
- 19005 NE 139th St
- 10516 NE 209th Ave
- 24304 NE Richards Rd
- 17602 NE 232nd Ave
- 15600 NE 194th Ct
- 17401 NE 217th Ave
- 14408 NE 188th Ave
- 0 205850000 205851000 Unit 24593604
- 22613 NE 139th St
- 13717 NE 223rd Ct
- 13715 NE 223rd Ct
- 22707 NE 139th St
- 13606 NE Powell Rd
- 22502 NE 139th St
- 13624 NE Powell Rd
- 22803 NE 139th St
- 13719 NE 223rd Ct
- 13522 NE Powell Rd
- 0 Powell Rd
- 13703 NE 223rd Ct
- 13907 NE Echo Ridge Rd
- 14003 NE 226th Ct
- 22420 NE 139th St
- 22718 NE 139th St
- 13520 NE Powell Rd
- 13510 NE 228th Ct
- 14013 NE 226th Ct
- 13426 NE Powell Rd