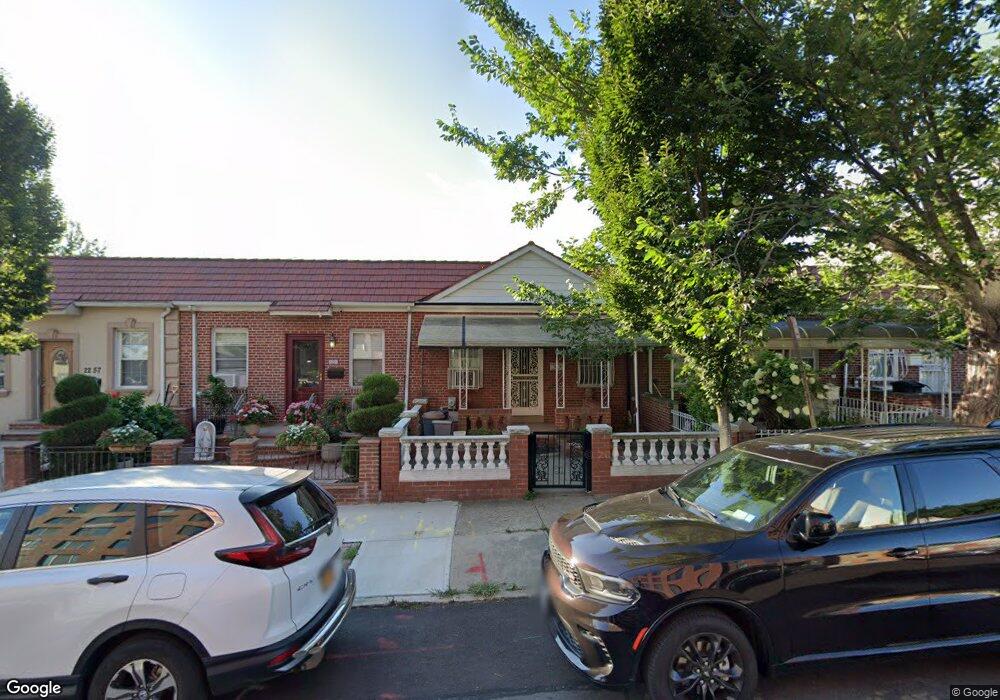
2261 46th St Astoria, NY 11105
Ditmars Steinway NeighborhoodEstimated Value: $871,000 - $953,000
--
Bed
--
Bath
700
Sq Ft
$1,312/Sq Ft
Est. Value
About This Home
This home is located at 2261 46th St, Astoria, NY 11105 and is currently estimated at $918,595, approximately $1,312 per square foot. 2261 46th St is a home located in Queens County with nearby schools including P.S. 84 Steinway, Is 141 The Steinway, and William Cullen Bryant High School.
Ownership History
Date
Name
Owned For
Owner Type
Purchase Details
Closed on
Dec 9, 2009
Sold by
Angelopoulos Penelope and Angelopoulos Prodromos
Bought by
Newman Paul and Phillips Anthy
Current Estimated Value
Home Financials for this Owner
Home Financials are based on the most recent Mortgage that was taken out on this home.
Original Mortgage
$400,000
Outstanding Balance
$261,184
Interest Rate
5%
Mortgage Type
Purchase Money Mortgage
Estimated Equity
$657,411
Purchase Details
Closed on
Jun 3, 1998
Sold by
Braun Camille A and Braun Albert C
Bought by
Angelopoulos Prodromos and Angelopoulos Penelope
Home Financials for this Owner
Home Financials are based on the most recent Mortgage that was taken out on this home.
Original Mortgage
$141,300
Interest Rate
6.98%
Mortgage Type
Purchase Money Mortgage
Create a Home Valuation Report for This Property
The Home Valuation Report is an in-depth analysis detailing your home's value as well as a comparison with similar homes in the area
Home Values in the Area
Average Home Value in this Area
Purchase History
| Date | Buyer | Sale Price | Title Company |
|---|---|---|---|
| Newman Paul | $525,000 | -- | |
| Newman Paul | $525,000 | -- | |
| Angelopoulos Prodromos | $157,000 | Chicago Title Insurance Co | |
| Angelopoulos Prodromos | $157,000 | Chicago Title Insurance Co |
Source: Public Records
Mortgage History
| Date | Status | Borrower | Loan Amount |
|---|---|---|---|
| Open | Newman Paul | $400,000 | |
| Closed | Newman Paul | $400,000 | |
| Previous Owner | Angelopoulos Prodromos | $141,300 |
Source: Public Records
Tax History Compared to Growth
Tax History
| Year | Tax Paid | Tax Assessment Tax Assessment Total Assessment is a certain percentage of the fair market value that is determined by local assessors to be the total taxable value of land and additions on the property. | Land | Improvement |
|---|---|---|---|---|
| 2025 | $7,618 | $40,205 | $8,657 | $31,548 |
| 2024 | $7,618 | $37,930 | $9,781 | $28,149 |
| 2023 | $7,513 | $37,404 | $9,210 | $28,194 |
| 2022 | $7,124 | $46,080 | $10,800 | $35,280 |
| 2021 | $7,148 | $49,320 | $10,800 | $38,520 |
| 2020 | $6,796 | $51,720 | $10,800 | $40,920 |
| 2019 | $6,319 | $51,900 | $10,800 | $41,100 |
| 2018 | $6,056 | $31,170 | $7,803 | $23,367 |
| 2017 | $5,762 | $29,738 | $10,215 | $19,523 |
| 2016 | $5,349 | $29,738 | $10,215 | $19,523 |
| 2015 | $3,164 | $27,920 | $10,596 | $17,324 |
| 2014 | $3,164 | $26,340 | $12,000 | $14,340 |
Source: Public Records
Map
Nearby Homes
- 22-54 46th St Unit 704
- 22-54 46th St Unit 803
- 22-54 46th St Unit 302
- 22-54 46th St Unit 403
- 22-54 46th St Unit 504
- 22-54 46th St Unit 201
- 45-02 Ditmars Blvd Unit 231
- 22-61 47th St
- 22-31 47th St
- 2233 47th St
- 22-44 43rd St
- 2244 43rd St
- 47-18 Ditmars Blvd
- 2151 48th St
- 21-20 47th St
- 22-03 Steinway St
- 21-14 45th St
- 43-14 21st Ave
- 4612 25th Ave
- 70-11 Ditmars Blvd