2261 James Cir Lynden, WA 98264
Estimated Value: $916,520 - $1,330,000
6
Beds
4
Baths
3,924
Sq Ft
$265/Sq Ft
Est. Value
About This Home
This home is located at 2261 James Cir, Lynden, WA 98264 and is currently estimated at $1,040,630, approximately $265 per square foot. 2261 James Cir is a home located in Whatcom County with nearby schools including Lynden High School, Lynden Christian Schools: Administration, and Cornerstone Christian School.
Ownership History
Date
Name
Owned For
Owner Type
Purchase Details
Closed on
Feb 9, 2022
Sold by
Engels and Sally
Bought by
Souve Roger and Souve Shaunmarie
Current Estimated Value
Home Financials for this Owner
Home Financials are based on the most recent Mortgage that was taken out on this home.
Original Mortgage
$435,000
Interest Rate
3.55%
Mortgage Type
New Conventional
Purchase Details
Closed on
Oct 28, 2002
Sold by
Ajl Llc
Bought by
Engels Michael and Engels Sally
Home Financials for this Owner
Home Financials are based on the most recent Mortgage that was taken out on this home.
Original Mortgage
$67,500
Interest Rate
5.99%
Mortgage Type
Seller Take Back
Purchase Details
Closed on
Jul 21, 2000
Sold by
L T Brisbane & Company Llc
Bought by
Ajl Llc
Create a Home Valuation Report for This Property
The Home Valuation Report is an in-depth analysis detailing your home's value as well as a comparison with similar homes in the area
Home Values in the Area
Average Home Value in this Area
Purchase History
| Date | Buyer | Sale Price | Title Company |
|---|---|---|---|
| Souve Roger | $885,000 | Whatcom Land Title | |
| Engels Michael | -- | Chicago Title Insurance | |
| Ajl Llc | -- | Island Title |
Source: Public Records
Mortgage History
| Date | Status | Borrower | Loan Amount |
|---|---|---|---|
| Previous Owner | Souve Roger | $435,000 | |
| Previous Owner | Engels Michael | $67,500 |
Source: Public Records
Tax History Compared to Growth
Tax History
| Year | Tax Paid | Tax Assessment Tax Assessment Total Assessment is a certain percentage of the fair market value that is determined by local assessors to be the total taxable value of land and additions on the property. | Land | Improvement |
|---|---|---|---|---|
| 2024 | $5,991 | $848,622 | $266,750 | $581,872 |
| 2023 | $5,991 | $834,492 | $275,000 | $559,492 |
| 2022 | $6,115 | $803,241 | $198,561 | $604,680 |
| 2021 | $5,998 | $663,827 | $164,098 | $499,729 |
| 2020 | $5,253 | $592,719 | $146,520 | $446,199 |
| 2019 | $4,674 | $543,545 | $134,530 | $409,015 |
| 2018 | $5,108 | $495,757 | $122,551 | $373,206 |
| 2017 | $4,928 | $444,984 | $110,000 | $334,984 |
| 2016 | $4,637 | $456,635 | $99,000 | $357,635 |
| 2015 | $4,110 | $427,344 | $95,220 | $332,124 |
| 2014 | -- | $412,873 | $91,980 | $320,893 |
| 2013 | -- | $410,893 | $90,000 | $320,893 |
Source: Public Records
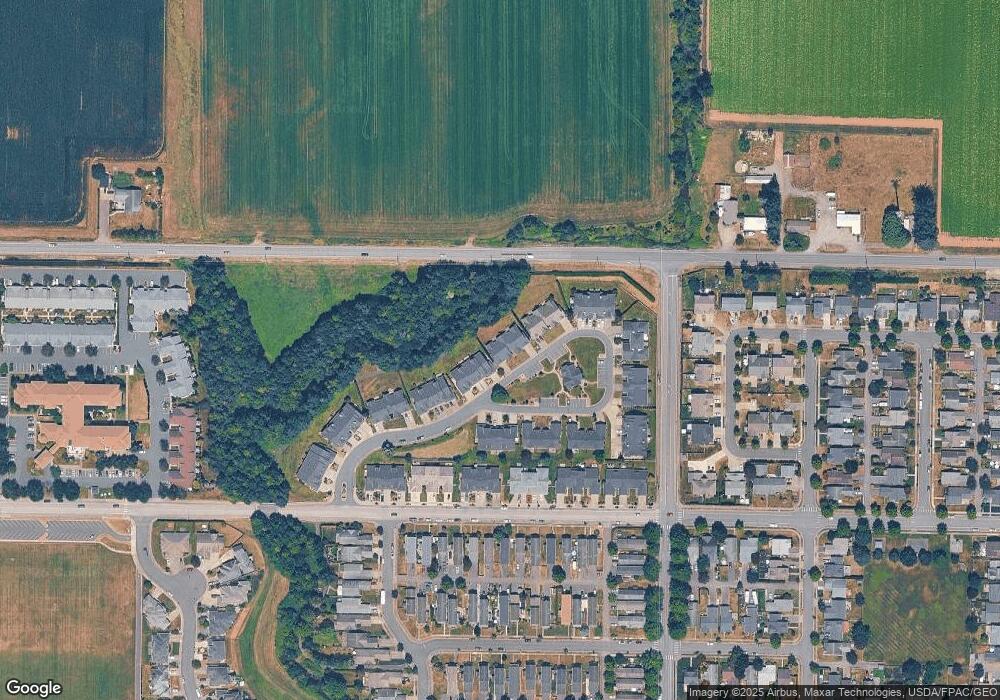
Map
Nearby Homes
- 2205 Dejong Dr
- 2201 Dejong Dr
- 8885 Line Rd
- 1136 N Cascade Ct
- 1112 N Cascade Ct
- 1660 Eastwood Way
- 1725 Aaron Dr
- 2202 Berryman Loop
- 9586 Bender Rd
- 1251 Garden Cir
- 1402 Bradley Meadows Ln
- 1319 Bradley Ct
- 114 Twin Sister Loop
- 8639 Bender Rd
- 8872 Depot Rd Unit 203
- 8844 Depot Rd Unit B204
- 1178 E Grover St Unit 101
- 107 Springview Dr
- 137 E Cedar Dr
- 8780 Depot Rd Unit 207
- 2249 James Cir Unit D
- 2249 James Cir Unit C
- 2249 James Cir Unit B
- 2249 James Cir Unit A
- 2249 James Cir
- 2273 James Cir Unit B
- 2273 James Cir Unit A
- 2273 James Cir Unit 1A
- 2297 James Cir
- 2237 James Cir Unit D
- 2237 James Cir Unit C
- 2237 James Cir Unit B
- 2237 James Cir Unit A
- 2237 James Cir
- 2237 James St Unit D
- 2236 James Cir Unit D
- 2236 James Cir Unit C
- 2236 James Cir Unit B
- 2236 James Cir Unit A
- 2236 James Cir