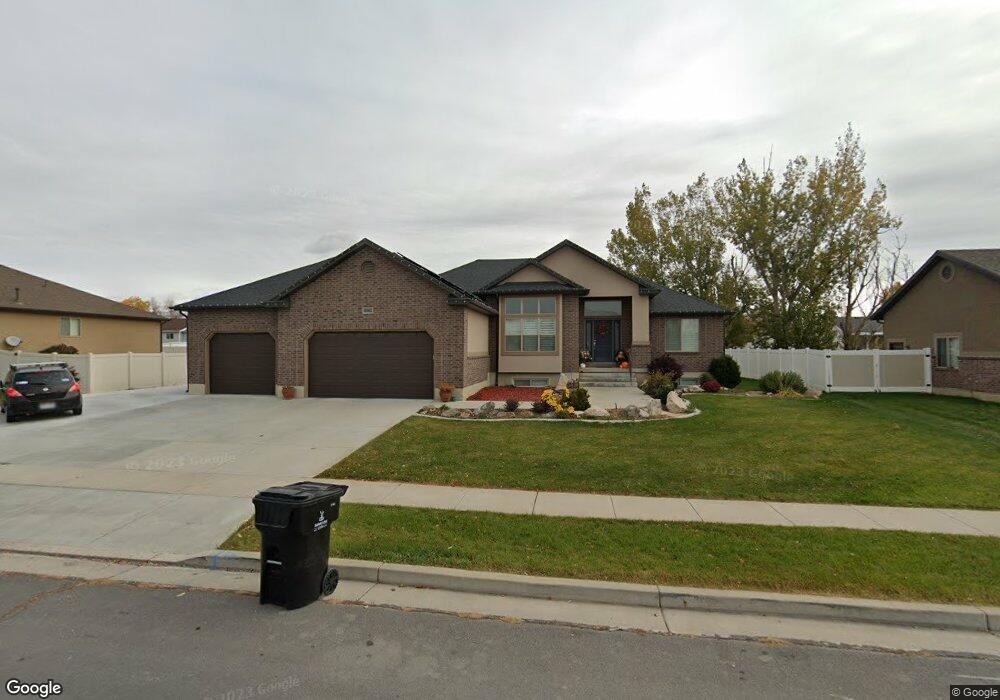
2261 S 1660 W Syracuse, UT 84075
Estimated Value: $597,000 - $688,874
--
Bed
3
Baths
1,820
Sq Ft
$355/Sq Ft
Est. Value
About This Home
This home is located at 2261 S 1660 W, Syracuse, UT 84075 and is currently estimated at $645,719, approximately $354 per square foot. 2261 S 1660 W is a home with nearby schools including Cook School, Syracuse Junior High School, and Syracuse High School.
Ownership History
Date
Name
Owned For
Owner Type
Purchase Details
Closed on
Oct 11, 2013
Sold by
Outwest Builder Inc
Bought by
Andersen Brian J and Andersen Rachel P
Current Estimated Value
Home Financials for this Owner
Home Financials are based on the most recent Mortgage that was taken out on this home.
Original Mortgage
$300,600
Outstanding Balance
$225,114
Interest Rate
4.49%
Mortgage Type
New Conventional
Estimated Equity
$420,605
Purchase Details
Closed on
Apr 29, 2013
Sold by
Outwest Investments Inc
Bought by
Andersen Brian J and Andersen Rachel P
Home Financials for this Owner
Home Financials are based on the most recent Mortgage that was taken out on this home.
Original Mortgage
$265,200
Interest Rate
3.51%
Mortgage Type
Construction
Purchase Details
Closed on
Dec 27, 2010
Sold by
Coxey Construction & Remodeling Inc
Bought by
Outwest Investments Inc
Create a Home Valuation Report for This Property
The Home Valuation Report is an in-depth analysis detailing your home's value as well as a comparison with similar homes in the area
Home Values in the Area
Average Home Value in this Area
Purchase History
| Date | Buyer | Sale Price | Title Company |
|---|---|---|---|
| Andersen Brian J | -- | Dep Ecash Recd For Founders | |
| Andersen Brian J | -- | Founders Title Co L | |
| Outwest Investments Inc | -- | Aspen Title Insurance Age |
Source: Public Records
Mortgage History
| Date | Status | Borrower | Loan Amount |
|---|---|---|---|
| Open | Andersen Brian J | $300,600 | |
| Previous Owner | Andersen Brian J | $265,200 |
Source: Public Records
Tax History
| Year | Tax Paid | Tax Assessment Tax Assessment Total Assessment is a certain percentage of the fair market value that is determined by local assessors to be the total taxable value of land and additions on the property. | Land | Improvement |
|---|---|---|---|---|
| 2025 | $3,620 | $349,250 | $126,251 | $222,999 |
| 2024 | $3,414 | $331,650 | $105,654 | $225,996 |
| 2023 | $3,288 | $582,000 | $147,145 | $434,855 |
| 2022 | $3,645 | $353,650 | $84,532 | $269,118 |
| 2021 | $3,276 | $492,000 | $125,060 | $366,940 |
| 2020 | $2,936 | $427,000 | $108,320 | $318,680 |
| 2019 | $2,758 | $396,000 | $106,638 | $289,362 |
| 2018 | $2,583 | $368,000 | $102,580 | $265,420 |
| 2016 | $2,374 | $177,430 | $39,345 | $138,085 |
| 2015 | $2,209 | $157,245 | $39,345 | $117,900 |
| 2014 | $2,122 | $153,924 | $39,345 | $114,579 |
| 2013 | -- | $33,125 | $33,125 | $0 |
Source: Public Records
Map
Nearby Homes
- 2013 S 1575 W
- 1996 S 1675 W
- 1876 W 2400 S
- 1294 W 2375 S
- 1284 W 2375 S
- 1857 W 2575 S
- 2423 S 2000 W
- 2621 S 1580 W
- 1283 W 2375 S
- 2356 S 1230 W
- 2366 S 1230 W
- 2071 W 2200 S
- 1196 W 2325 S
- 1643 W 2700 S Unit 216
- 1653 W 2700 S Unit 218
- 2742 S Allison Way Unit 212
- 2718 S 1710 W Unit 227
- 2721 S Allison Way
- 1134 W 2275 S
- 1667 W 2770 S Unit 206
- 2283 S 1660 W
- 2239 S 1660 W
- 2258 Allison Way
- 2276 Allison Way
- 2240 Allison Way
- 2292 Allison Way
- 1662 W Dutch Manor Ct
- 2301 S 1660 W
- 2219 S 1660 W
- 2219 S 1660 W Unit 2
- 2222 Allison Way
- 1661 W Dutch Manor Ct
- 2310 Allison Way
- 1682 W Dutch Manor Ct
- 2228 S 1660 W
- 2214 Allison Way
- 2207 S 1660 W
- 2323 S 1660 W Unit 201
- 2323 S 1660 W
- 2255 Allison Way
Your Personal Tour Guide
Ask me questions while you tour the home.