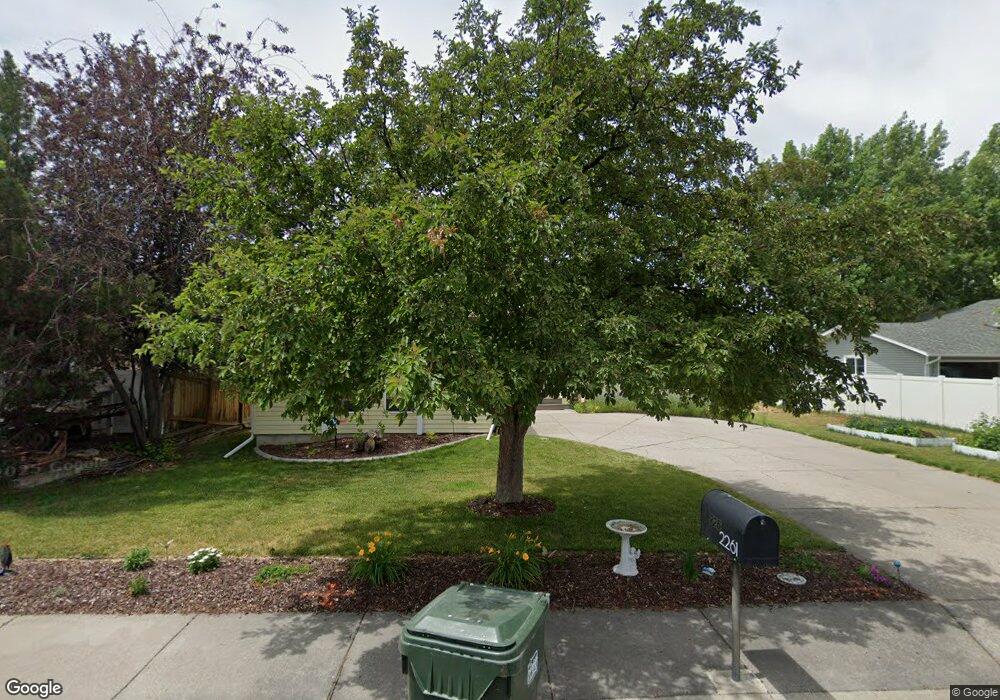
2261 Tonja Ln Pocatello, ID 83201
Highland NeighborhoodEstimated Value: $406,000 - $512,000
6
Beds
3
Baths
2,978
Sq Ft
$148/Sq Ft
Est. Value
About This Home
This home is located at 2261 Tonja Ln, Pocatello, ID 83201 and is currently estimated at $441,633, approximately $148 per square foot. 2261 Tonja Ln is a home located in Bannock County with nearby schools including Gate City Elementary School, Franklin Middle School, and Highland High School.
Ownership History
Date
Name
Owned For
Owner Type
Purchase Details
Closed on
May 4, 2023
Sold by
Lombard Deeann and Lombard James Michael
Bought by
Nielsen Rebecca and Nielsen Kyle
Current Estimated Value
Home Financials for this Owner
Home Financials are based on the most recent Mortgage that was taken out on this home.
Original Mortgage
$379,905
Outstanding Balance
$369,206
Interest Rate
6.32%
Mortgage Type
New Conventional
Estimated Equity
$72,427
Purchase Details
Closed on
Aug 12, 2020
Sold by
Lombard Stephen
Bought by
Lombard Deeann
Purchase Details
Closed on
Mar 22, 2006
Sold by
Kramer Brad Steven and Kramer Keri
Bought by
Lombard Stephen M and Lombard Deeann
Home Financials for this Owner
Home Financials are based on the most recent Mortgage that was taken out on this home.
Original Mortgage
$33,980
Interest Rate
5.76%
Mortgage Type
Stand Alone Second
Create a Home Valuation Report for This Property
The Home Valuation Report is an in-depth analysis detailing your home's value as well as a comparison with similar homes in the area
Home Values in the Area
Average Home Value in this Area
Purchase History
| Date | Buyer | Sale Price | Title Company |
|---|---|---|---|
| Nielsen Rebecca | -- | Flying S Title And Escrow | |
| Lombard Deeann | -- | None Available | |
| Lombard Stephen M | -- | -- |
Source: Public Records
Mortgage History
| Date | Status | Borrower | Loan Amount |
|---|---|---|---|
| Open | Nielsen Rebecca | $379,905 | |
| Previous Owner | Lombard Stephen M | $33,980 | |
| Previous Owner | Lombard Stephen M | $135,920 |
Source: Public Records
Tax History Compared to Growth
Tax History
| Year | Tax Paid | Tax Assessment Tax Assessment Total Assessment is a certain percentage of the fair market value that is determined by local assessors to be the total taxable value of land and additions on the property. | Land | Improvement |
|---|---|---|---|---|
| 2024 | $2,731 | $345,719 | $79,000 | $266,719 |
| 2023 | $3,016 | $371,956 | $79,000 | $292,956 |
| 2022 | $3,016 | $286,894 | $57,500 | $229,394 |
| 2021 | $2,736 | $286,894 | $57,500 | $229,394 |
| 2020 | $2,278 | $244,237 | $57,500 | $186,737 |
| 2019 | $2,591 | $233,526 | $44,800 | $188,726 |
| 2018 | $2,091 | $187,443 | $40,000 | $147,443 |
| 2017 | $2,075 | $187,443 | $40,000 | $147,443 |
| 2016 | $1,833 | $166,489 | $38,500 | $127,989 |
| 2015 | $1,851 | $0 | $0 | $0 |
| 2012 | -- | $166,489 | $38,500 | $127,989 |
Source: Public Records
Map
Nearby Homes
- 2717 Clearwater St
- 2181 Satterfield Dr
- 2125 Diane Ln
- 3057 Trevor St
- 2088 Satterfield Dr
- 1999 Satterfield Dr
- 2180 Steven St
- 2027 Mariah Way
- 3076 Lois Ln
- 2101 Keagan Ct
- 1978 Diane Ln
- 3163 Owyhee St
- 2416 Courtney St
- 2143 Ryker St
- 1963 Anita Place
- 2244 Elmore St
- 2324 Greenfield Dr
- 1957 Mariah Way
- 2430 Greenfield Dr
- 2175 Butte St
- 2271 Tonja Ln
- 2251 Tonja Ln
- 2264 Jacqueline Ln
- 2254 Jacqueline Ln
- 2281 Tonja Ln
- 2241 Tonja Ln
- 2254 Tonja Ln
- 2264 Tonja Ln
- 2274 Jacqueline Ln
- 2284 Jacqueline Ln
- 2240 Tonja Ln
- 2244 Jacqueline Ln
- 2276 Tonja Ln
- 2785 Kootenai St
- 2288 Tonja Ln
- 2259 Jacqueline Ln
- 2294 Jacqueline Ln
- 2249 Satterfield Dr
- 2279 Jacqueline Ln
- 2233 Satterfield Dr