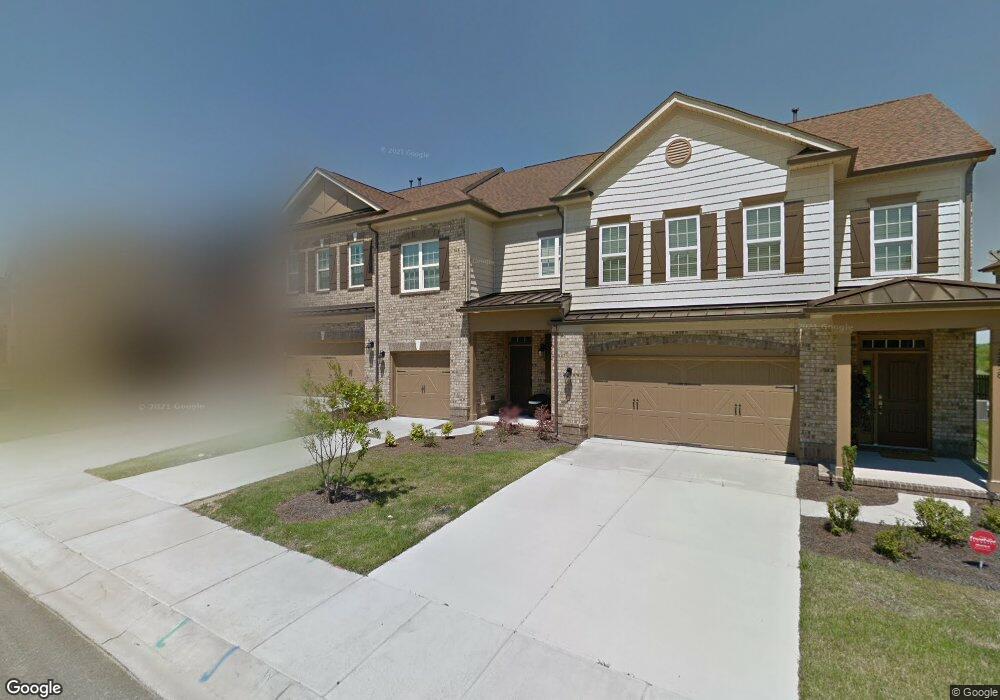
2262 Eversham Dr NW Unit 482 Concord, NC 28027
Estimated Value: $370,885 - $408,000
3
Beds
3
Baths
1,661
Sq Ft
$239/Sq Ft
Est. Value
About This Home
This home is located at 2262 Eversham Dr NW Unit 482, Concord, NC 28027 and is currently estimated at $396,471, approximately $238 per square foot. 2262 Eversham Dr NW Unit 482 is a home located in Cabarrus County with nearby schools including Cox Mill Elementary School, Harold E. Winkler Middle School, and Cox Mill High School.
Ownership History
Date
Name
Owned For
Owner Type
Purchase Details
Closed on
May 28, 2020
Sold by
Roisin Terra E
Bought by
Chappell Paula
Current Estimated Value
Home Financials for this Owner
Home Financials are based on the most recent Mortgage that was taken out on this home.
Original Mortgage
$250,260
Outstanding Balance
$222,250
Interest Rate
3.3%
Mortgage Type
New Conventional
Estimated Equity
$174,221
Purchase Details
Closed on
Jan 13, 2014
Sold by
Crriage Town At Christenbury Llc
Bought by
Roisin Terra E
Home Financials for this Owner
Home Financials are based on the most recent Mortgage that was taken out on this home.
Original Mortgage
$166,131
Interest Rate
4.37%
Mortgage Type
Adjustable Rate Mortgage/ARM
Purchase Details
Closed on
Jun 1, 2013
Sold by
Christenbury Land Investments
Bought by
Carriage Towns At Christenbury
Create a Home Valuation Report for This Property
The Home Valuation Report is an in-depth analysis detailing your home's value as well as a comparison with similar homes in the area
Home Values in the Area
Average Home Value in this Area
Purchase History
| Date | Buyer | Sale Price | Title Company |
|---|---|---|---|
| Chappell Paula | $258,000 | None Available | |
| Roisin Terra E | $175,000 | None Available | |
| Carriage Towns At Christenbury | $140,000 | -- |
Source: Public Records
Mortgage History
| Date | Status | Borrower | Loan Amount |
|---|---|---|---|
| Open | Chappell Paula | $250,260 | |
| Previous Owner | Roisin Terra E | $166,131 |
Source: Public Records
Tax History Compared to Growth
Tax History
| Year | Tax Paid | Tax Assessment Tax Assessment Total Assessment is a certain percentage of the fair market value that is determined by local assessors to be the total taxable value of land and additions on the property. | Land | Improvement |
|---|---|---|---|---|
| 2025 | $3,539 | $355,310 | $92,500 | $262,810 |
| 2024 | $3,539 | $355,310 | $92,500 | $262,810 |
| 2023 | $2,923 | $239,560 | $63,000 | $176,560 |
| 2022 | $2,923 | $239,560 | $63,000 | $176,560 |
| 2021 | $2,923 | $239,560 | $63,000 | $176,560 |
| 2020 | $2,828 | $231,830 | $63,000 | $168,830 |
| 2019 | $2,218 | $181,770 | $48,000 | $133,770 |
| 2018 | $2,181 | $181,770 | $48,000 | $133,770 |
| 2017 | $2,145 | $181,770 | $48,000 | $133,770 |
| 2016 | $1,272 | $173,170 | $45,000 | $128,170 |
| 2015 | $531 | $173,170 | $45,000 | $128,170 |
| 2014 | $531 | $173,170 | $45,000 | $128,170 |
Source: Public Records
Map
Nearby Homes
- 9595 Ledbury Ct NW
- 9655 Camberley Ave NW
- 2346 Donnington Ln NW
- 9212 Delancey Ln NW Unit 63
- 2134 Barrowcliffe Dr NW Unit 6
- 2377 Maple Grove Ln NW
- 2251 Barrowcliffe Dr NW
- 2506 Susie Brumley Place NW
- 2414 Riders Glen Ct
- 9509 Pacing Ln NW
- 9516 Pacing Ln NW
- 2111 Elendil Ln
- 2277 Elendil Ln
- 3155 Golden Dale Ln
- 3561 Calpella Ct
- 3549 Calpella Ct
- 2055 Solway Ln
- 3516 Calpella Ct
- 1930 Wilburn Park Ln NW
- 3930 Kalispell Ln
- 2262 Eversham Dr NW
- 2258 Eversham Dr NW
- 2258 Eversham Dr NW Unit 483
- 2266 Eversham Dr NW Unit 481
- 2270 Eversham Dr NW
- 2270 Eversham Dr NW Unit 480
- 2274 Eversham Dr NW Unit 479
- 2248 Eversham Dr NW Unit 484
- 2278 Eversham Dr NW Unit 478
- 2242 Eversham Dr NW Unit 485
- 2245 Donnington Ln NW
- 2282 Eversham Dr NW Unit 477
- 2238 Eversham Dr NW Unit 490
- 2263 Eversham Dr NW
- 2259 Eversham Dr NW
- 2290 Woburn Abbey Dr NW Unit B
- 2267 Eversham Dr NW Unit 2267
- 2267 Eversham Dr NW Unit 555
- 2286 Eversham Dr NW
- 2286 Eversham Dr NW Unit 476